- Press and hold down the left mouse button and move the mouse to rotate.
- Press and hold down the central mouse button and move the mouse to translate.
- Use the mouse wheel to zoom in or out.
- Click on any atom on your molecule and the corresponding residue label will be placed beneath the viewer.
| Color | ConSurf Grade |
| No Conservation data available | |
| 1 | |
| 2 | |
| 3 | |
| 4 | |
| 5 | |
| 6 | |
| 7 | |
| 8 | |
| 9 |
All columns can be sorted in ascending/descending alphabetical order, clicking on the corresponding column header.
Index: link id, click on each number to highlight the corresponding link in the 3D visualization.
Node1 Node2: the two nodes of the corresponding link.
Int. Strength: the interaction strength between the two nodes.
Hub1?, Hub2?: "Yes" if the corresponding node has more than 3 links, otherwise "No".
Community: the id of the community the link belong to, otherwise 0.
ConSurf1, ConSurf2: these columns report the ConSurf conservation grades of the two nodes involved in a link.
| Color | ConSurf Grade |
| No Conservation data available | |
| 1 | |
| 2 | |
| 3 | |
| 4 | |
| 5 | |
| 6 | |
| 7 | |
| 8 | |
| 9 |
All columns can be sorted in ascending/descending alphabetical order, clicking on the corresponding column header.
Index: hub id, click on each number to highlight the corresponding hub in the 3D visualization.
Hub: the hub being considered.
Avg Int. Strength: the average interaction strength of all the links of the corresponding hub.
Num Of Links: the number of links of the corresponding hub.
Community: the id of the community the link belong to, otherwise 0.
ConSurf: this column reports the ConSurf conservation grades of each hub.
| Color | ConSurf Grade |
| No Conservation data available | |
| 1 | |
| 2 | |
| 3 | |
| 4 | |
| 5 | |
| 6 | |
| 7 | |
| 8 | |
| 9 |
All columns can be sorted in ascending/descending alphabetical order, clicking on the corresponding column header.
Index: link id, click on each number to highlight the corresponding link in the 3D visualization.
Node1 Node2: the two nodes of the corresponding link.
Recurrence: the relative Recurrence in the pool of shortest paths.
Strength: the interaction strength between the two nodes.
Hub1?, Hub2?: "Yes" if the corresponding node has more than 3 links, otherwise "No".
Community: the id of the community the link belong to, otherwise 0.
ConSurf1, ConSurf2: these columns report the ConSurf conservation grades of the two nodes involved in a link.
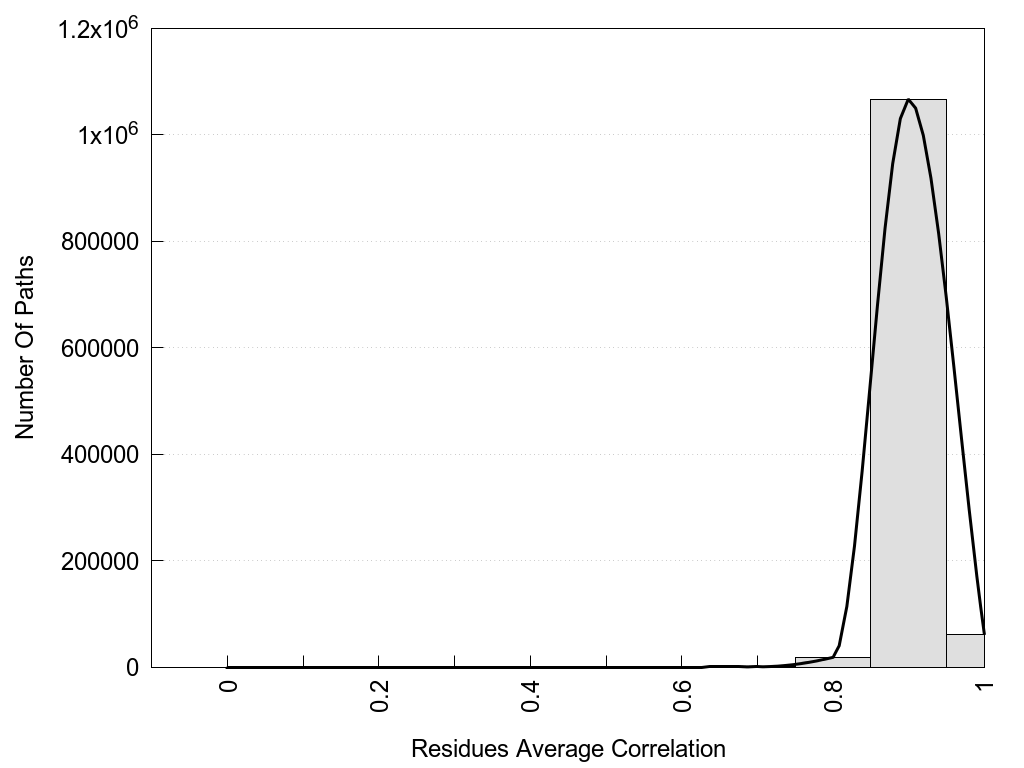
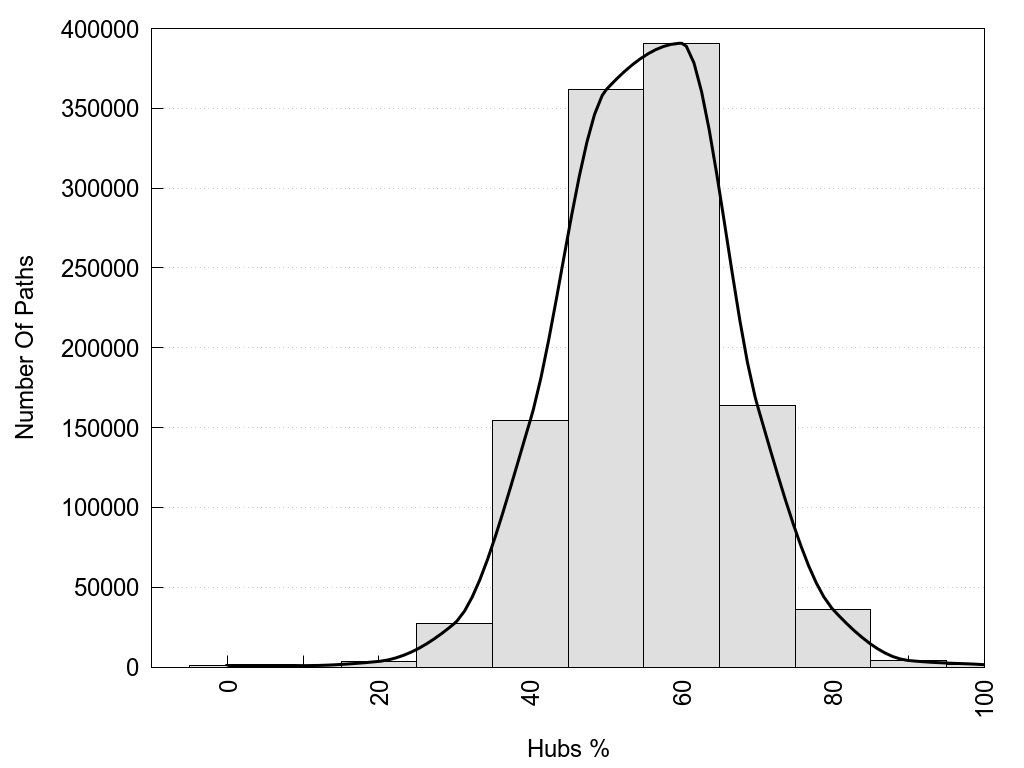
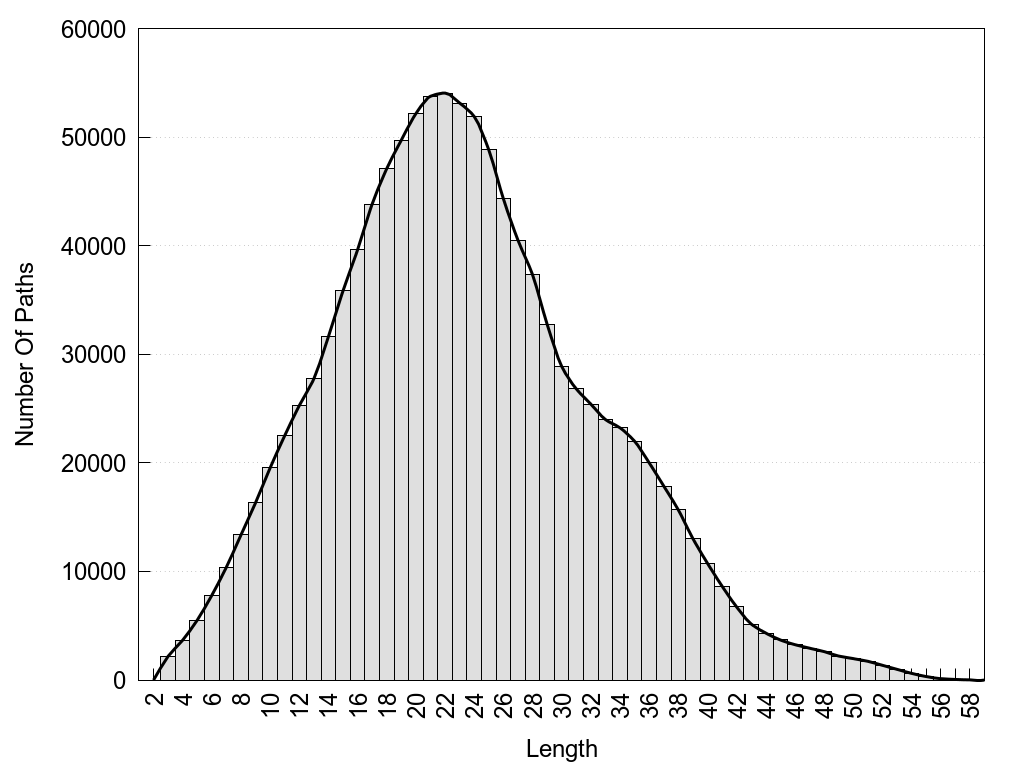
2D representation of the global metapath, ligand(s) interactions and
histograms of path distribution according to several parameters
(click on the image to enlarge it 🔍):
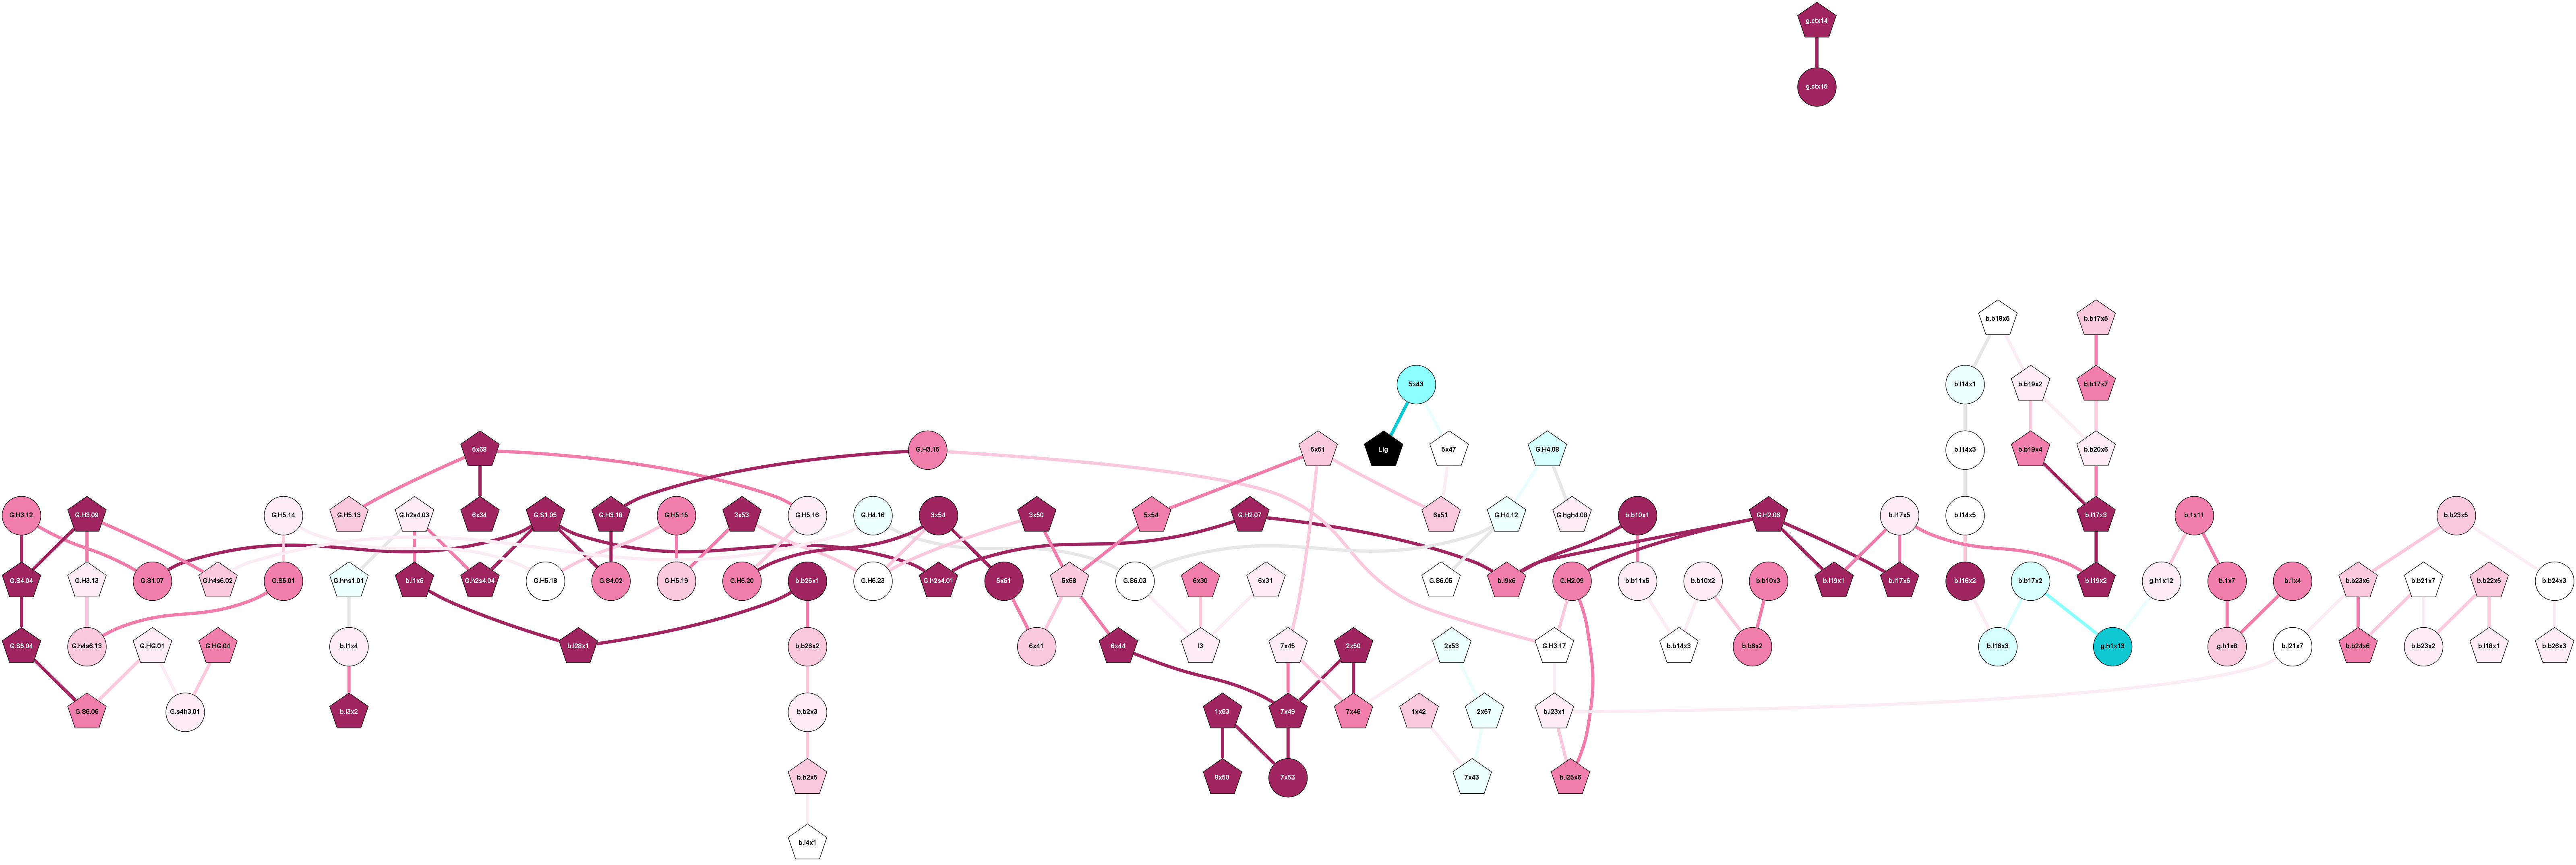
A 2D representation of the global communication in the network.
ConSurf Conservation Grade (See documentation):
n/a 1 2 3 4 5 6 7 8 9
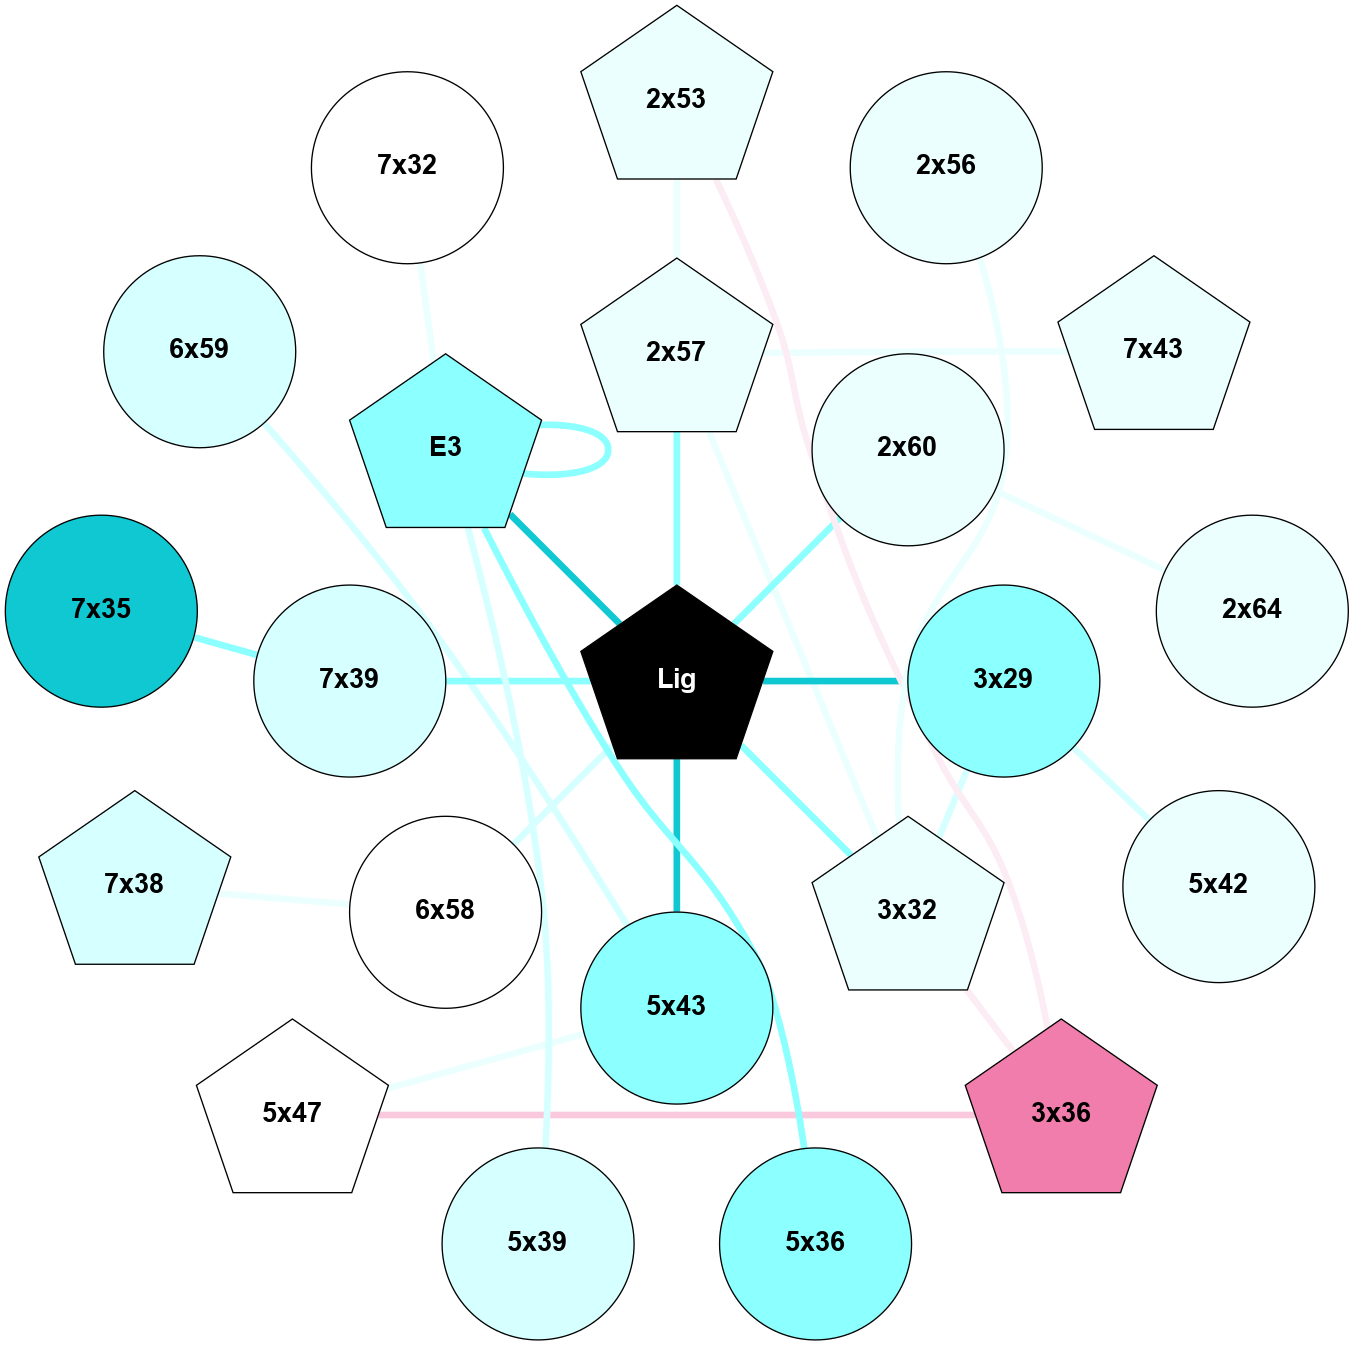
2D representation of the interactions of this orthosteric/allosteric ligand. | |||||||||||||||||||||||||||||||||||||||||||||||||||||||||||||||||||||||||||||||||||||||||||||||||||||||||||||||||||||||||||||||||||||||||||||||||||||||||||||||||||||||||||||||||||||||||||||||||||||||||||||||||||||||||||||||||||||||||||||||||||||||||||||||||||||||||||||||
Links and nodes colored according to ConSurf Conservation Grade (See documentation): n/a 1 2 3 4 5 6 7 8 9 |
| ||||||||||||||||||||||||||||||||||||||||||||||||||||||||||||||||||||||||||||||||||||||||||||||||||||||||||||||||||||||||||||||||||||||||||||||||||||||||||||||||||||||||||||||||||||||||||||||||||||||||||||||||||||||||||||||||||||||||||||||||||||||||||||||||||||||||||||||
Location and physicochemical properties of the interaction partners of this ligand | |||||||||||||||||||||||||||||||||||||||||||||||||||||||||||||||||||||||||||||||||||||||||||||||||||||||||||||||||||||||||||||||||||||||||||||||||||||||||||||||||||||||||||||||||||||||||||||||||||||||||||||||||||||||||||||||||||||||||||||||||||||||||||||||||||||||||||||||
Interactions of this ligand | |||||||||||||||||||||||||||||||||||||||||||||||||||||||||||||||||||||||||||||||||||||||||||||||||||||||||||||||||||||||||||||||||||||||||||||||||||||||||||||||||||||||||||||||||||||||||||||||||||||||||||||||||||||||||||||||||||||||||||||||||||||||||||||||||||||||||||||||
Similarities between the interactions of this ligand and those of other networks | |||||||||||||||||||||||||||||||||||||||||||||||||||||||||||||||||||||||||||||||||||||||||||||||||||||||||||||||||||||||||||||||||||||||||||||||||||||||||||||||||||||||||||||||||||||||||||||||||||||||||||||||||||||||||||||||||||||||||||||||||||||||||||||||||||||||||||||||
Details about the values in these tables can be found in the corresponding documentation page .
You can download a compressed (zip) file with structure(s), 3D outputs (as PyMol and VMD scripts) and numerical data files (as csv and plain text files).
Download gs_class-t.zipYou can click to copy the link of this page to easily come back here later
or use this QR code to link and share this page.
You can also read or download a guide explaining the meaning of all files and numerical data.
