Home
psnGPCRdb is a curated and up-to-date database for high throughput investigation of allosterism in experimentally resolved structures of G protein coupled receptors (GPCRs). GPCRs represent the largest superfamily in the human proteome and the targets of an estimated 30–40% of all drugs currently on the market. They share seven transmembrane helices organized in an up-down bundle architecture and can be classified into five major families (classes) and further divided into subfamilies based on sequence similarities.
psnGPCRdb stores the structure networks (i.e. linked nodes, hubs, communities and communication pathways) computed on all updated GPCR structures in the Protein Data Bank (PDB), in their isolated states or in complex with extracellular and/or intracellular molecules.
The structure networks were computed by the PSNtools software [1] that relies on a mixed Protein Structure Network (PSN) and Elastic Network Model-Normal Mode Analysis (ENM-NMA) [1-7, 10]. The approach proved valuable to investigate structure-function relationships in a number of studies [1-10].
psnGPCRdb provides the user with a friendly interface and an immediate feedback through graphical visualizations of the output.
The database offers the following features:
- single networks computed on isolated or complexed structures of GPCRs in different functional states (i.e. inactive and active);
- consensus networks of selected GPCRs within and among different subfamilies;
- differences between single or consensus networks concerning inactive and active GPCR states;
- high quality and publication-ready plots and 3D outputs (as PyMol and VMD scripts);
- downloads of preprocessed structure and network files to be used as inputs to compute difference and consensuses networks by the WebPSN server, using user-indicated/provided GPCR structural models.
- all structures have been subjected to a novel protocol for automatic side-chain completion and bump elimination prior to (re)calculating the networks
- a standalone version of ConSurf with a slightly different parameter setting is now employed to infer amino acid conservation, which have been updated for all protein sequences
- for each structural complex with the G protein, two versions of the metapath on the receptor are now available, computed in the presence and absence of the G protein
- if necessary, the GPCR labeling system and classification has been updated, according to changes in the GPCRdb
- consensus and difference networks have been updated with the newly released structures
Documentation
General Intro
Theory
Labels & Conservation Data
Description of Summary Tables
Downloadable Data Guide (web) (pdf)
References
Documentation → General Intro
The psnGPCRdb database employs a mixed Protein Structure Network (PSN) and Elastic Network Model-Normal Mode Analysis (ENM-NMA)-based strategy to investigate allosterism in GPCR[1,2]. PSN is used to compute the interaction strengths and connectivities among nodes while ENM-NMA provides information on system’s dynamics, which serves to compute the cross-correlation of atomic motions for path filtering. The method is hereafter indicated as PSN-ENM.
In synthesis, the first step in the PSN-ENM approach consists in performing the PSN analysis on a single high resolution structure, which serves to derive the network components (e.g. nodes, links, hubs, communities). Nodes interconnectivities represent also the basis to search for all possible shortest communication paths between all nodes in the network. The shortest paths are then filtered out according to the cross-correlation of atomic motions derived from ENM-NMA resulting in a reduced pool of paths composed of highly correlated nodes.
Finally, a global metapath made of the most recurrent links in the shortest path pool is computed to infer a coarse picture of the structural communication in the considered system. Single paths can be inferred as well by providing a single node pair as an input of path search. Important novelties concern the possibility to:
- compare Protein Structure Graphs (PSGs) (e.g. nodes, hubs, and links) or metapaths computed on two structures (i.e. difference network).
- infer links, hubs, communities, and metapaths from consensus networks computed on a set of GPCR.
Computation of consensus network allows to infer common structural communication features in proteins sharing the same functionality[1, 2, 5, 7, 9] or even sharing only the fold. On the other hand, computation of difference network is particularly useful to infer commonalties and differences in the structural communication of two functionally different states of the same protein[1, 2, 6, 7].
The psnGPCRdb database offers high quality and publication-ready plots and 3D outputs, as PyMol and VMD scripts, as well as a number of easy-to-access data files. Additionally, all these outputs are conveniently zipped for download.
Documentation → Theory
PSN analysis is a product of graph theory applied to protein and nucleic acid structures [4, 16]. A graph is defined by a set of vertices (nodes) and connections (edges) between them. In a PSN, each amino acid residue is represented as a node and these nodes are connected by edges based on the strength of non-covalent interactions between residues. The strength of interaction between residues i and j (Iij) is evaluated as a percentage given by equation 1:
| (1) |
where nij is the number of atom-atom pairs between the side chains of residues i and j within a distance cutoff of 4.5 Aring. Ni and Nj are normalization factors for residue types i and j, which account for the differences in size of the amino acid side chains and their propensity to make the maximum number of contacts with other amino acids in protein structures. Glycines, are now included in the PSN analysis. The webPSN server has an internal database with the normalization factors for the 20 standard amino acids and the 8 standard nucleotides (i.e. dA, dG, dC, dT, A, G, C, and U), as well as for more than 30,000 biologically relevant molecules and ions (ligands, lipids, sugars, etc) from the PDB. Additionally, the server automatically identifies un-parametrized molecules in the submitted PDB files and automatically calculates their normalization factors transparently.
Iij are calculated for all node pairs. At a given interaction strength cutoff, Imin, any residue pair ij for which Iij ≥ Imin is considered to be interacting and hence is connected. Node interconnectivity is used to highlight node clusters, where a cluster is a set of connected nodes in a graph. Cluster size, i.e., the number of nodes constituting a cluster, varies as a function of the Imin, and the size of the largest cluster is used to calculate the Icritic value. The latter is defined as the Imin, at which the size of the largest cluster is half the size of the largest cluster at Imin = 0.0%. Studies by Vishveshwara's [16] group found that optimal Imin corresponds to the one at which the largest cluster undergoes a transition. All resulting clusters are then iteratively connected by the link(s) with the highest sub-Icritic interaction strength to compensate, at least in part, for the lack of side chain fluctuations.
Residues making four or more edges are referred to as hubs at that particular Imin. Such cutoff for hub definition relates to the intrinsic limit in the possible number of non covalent connections made by an amino acid in protein structures due to steric constraints. The cutoff 4 is close to the upper limit. The majority of amino acid hubs indeed make from 4 to 6 links, with 4 being the most frequent value.
Finally, links are then used to highlight network communities, which are sets of highly interconnected nodes such that nodes belonging to the same community are densely linked to each other and poorly connected to nodes outside the community. Communities can be considered as fairly independent compartments of a graph. They are identified using a variant of the clique percolation method, by finding all the k=3-cliques, i.e. sets of three fully interconnected nodes, and then merging all those cliques sharing at least one node.
ENM
The combination between a coarse grained representation of a protein structure (e.g. ENM) and Normal Mode Analysis (NMA) is ever increasingly used to study the collective dynamics of complex systems. ENM-NMA is a coarse grained normal mode analysis technique able to describe the vibrational dynamics of protein systems around an energy minimum. With this technique, each protein/nucleic acid structure is described by a reduced subset of atoms corresponding to the Cα-atoms, for standard amino acids, and the atom nearest to the geometric center for all other molecules.
The interactions between particle pairs are given by a single term Hookean harmonic potential. The total energy of the system is thus described by the simple Hamiltonian:
| (2) |
where dij and dij0 are the instantaneous and equilibrium distances between particle i and j, respectively, whereas kij is a force constant, defined as:
| (3) |
where C is constant (with a default value of 40 Kcal/mol ·Å2).
The cross-correlations of motions for path filtering are obtained from the covariance matrix C [17]:
| (4) |
where Cij denotes the correlation between particles i and j, M is the number of modes considered for computation (the first 10 non-zero frequency modes), νxy and λy are, respectively, the xth element and the associated eigenvalue of the yth mode.
All ENM-NMA calculations are performed by means of the latest realease of our Wordom software [18]
Path Search
The search for all shortest paths relies on Dijkstra’s algorithm [19]. The method first finds all possible communication paths between all node pairs and then filters the results according to cross-correlation of atomic motions, as derived from ENM-NMA analysis.
Filtering consists in retaining only those shortest paths that contain only residues with a correlation ≥ 0.7 with at least one of the two path extremities (i.e. the first and last amino acids in the path).
Finally, filtered paths were used to build the global meta path, which is made of the most recurrent links, i.e. those links present in a number paths ≥ 10% of the number of paths in which the most recurrent link in present.
Such meta path represents a coarse/global picture of the structural communication in the considered system.
Labels & Conservation Data
Labels
When calculating the difference between two networks or a consensus among a pool of networks it is of fundamental importance to unambiguously identify structurally equivalent residues among processed receptors and associated proteins. A unique identifier, called label, is then associated to these equivalent residues and ligands to correctly compare residue/ligand interactions among the analyzed networks. Labels used in psnGPCRdb are based on the Generic GPCR Residue Numbers scheme of GPCRdb.[24]
Amino acid conservation - ConSurf
Conservation data reported in output tables, are obtained using the ConSurf web server.[25] Amino acid conservation values are expressed as nine conservation grades, from 1 to 9, where 1 includes the most rapidly evolving positions, 5 includes positions of intermediate rates, and 9 includes the most evolutionary conserved positions. We employed the WT sequences of each GPCR to run the ConSurf analysis.
Documentation → Description of Summary Tables
| Net Summary | |
|---|---|
| Imin | The minimum interaction strength needed to connect two nodes. More details about this value and how it is calculated can be found in the PSN section of the theory page. |
| Number of Linked Nodes | Total number of nodes with at least one link. |
| Number of Links | Total number of links with an interaction strength ≥ Imin. Links with a lower value may have been added to avoid excessive network fragmentation. More details about links with a sub-Imin interaction strength can be found in the PSN section of the theory page. |
| Number of Hubs | Total number of nodes with at least 4 links. More details about this cutoff can be found in the PSN section of the theory page. |
| Number of Links mediated by hubs | Total number of links mediated by hubs. |
| Number of Communities | Total number of communities. Communities are sets of highly interconnected nodes that can be viewed as fairly independent compartments of a graph. You can find a more detailed explanation of what a community is and how it is identified in the PSN section of the theory page. |
| Number of Nodes involved in Communities | Total number of nodes in a community. |
| Number of Links involved in Communities | Total number of links in a community. |
| Network Similarities | |
|---|---|
| Average % Shared Neighbours (Jaccard) |
Is the average of the ratio of the intersection over union of each node links.
Where n is a given node in network A and B, and An and Bn are the links of node n in network A and B, respectively [20]. 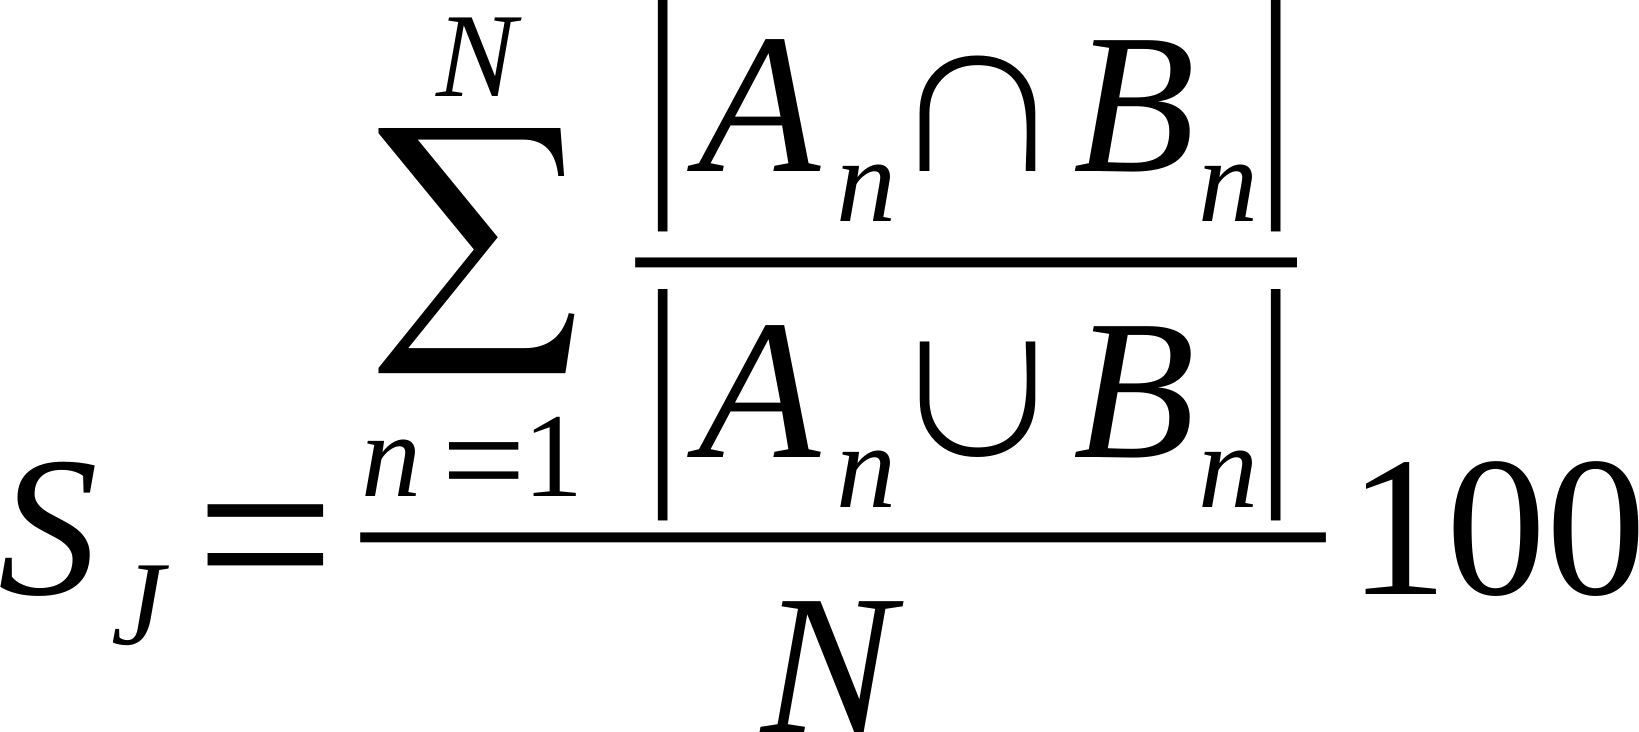
|
| Average % Shared Neighbours (Otsuka version of cosine similarity) |
Is the average of the ratio of the intersection over the square root of the product of the number of links made by each node in compared networks..
Where n is a given node in network A and B, and An and Bn are the links of node n in network A and B, respectively [21]. 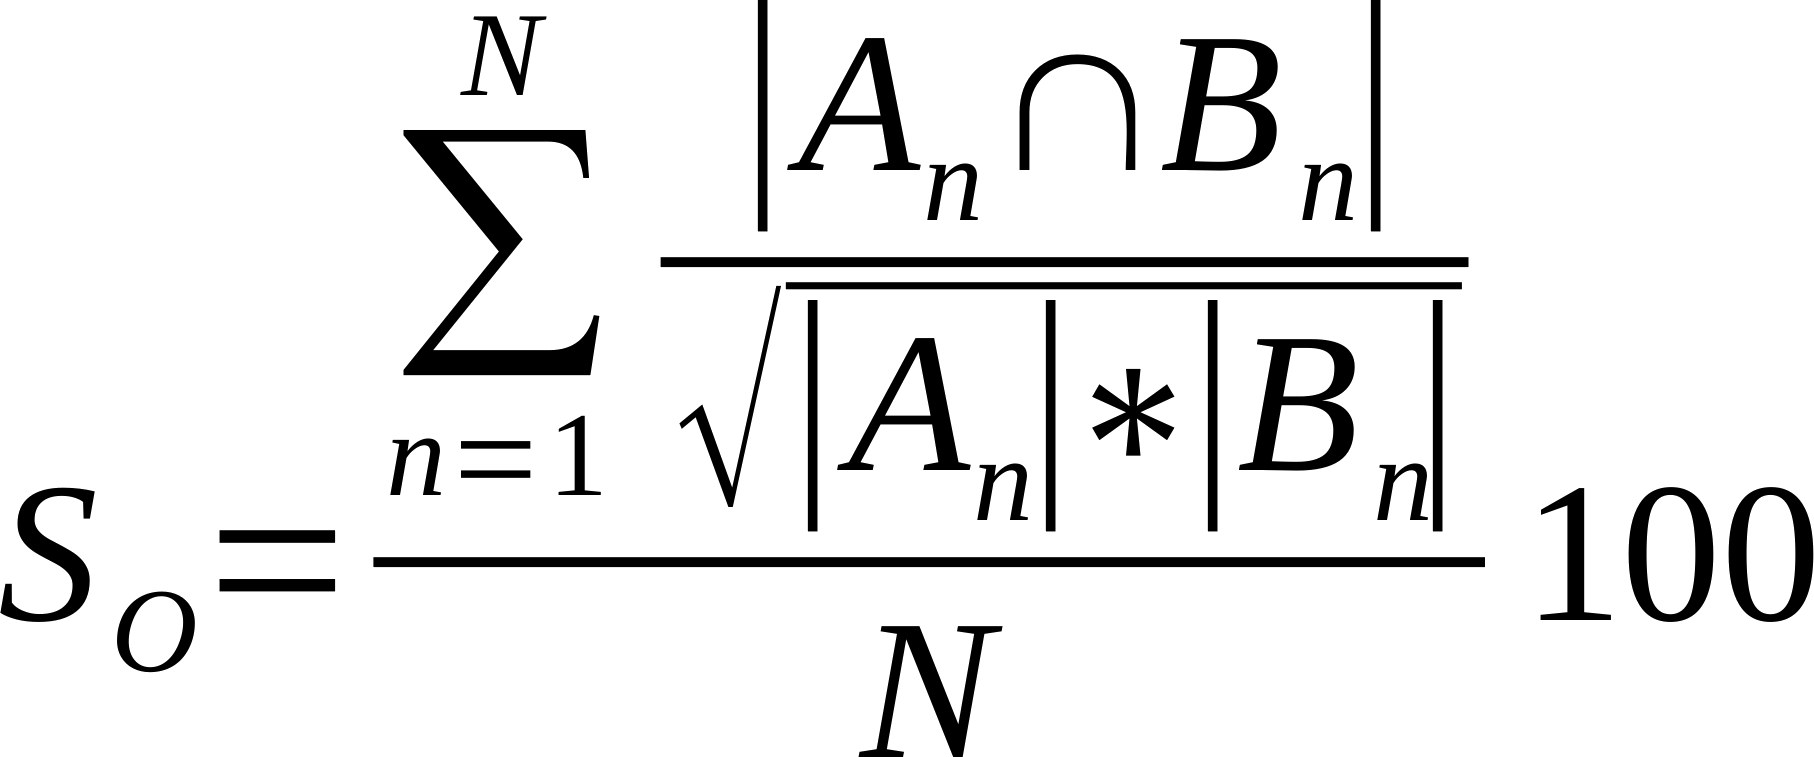
|
| Average % Shared Neighbours (Overlap Coefficient) |
Is the average of the ratio of the intersection over the smaller list of links made by each node. Also known as overlap coefficient.
Where n is a given node in network A and B, and An and Bn are the links of node n in network A and B, respectively [22]. 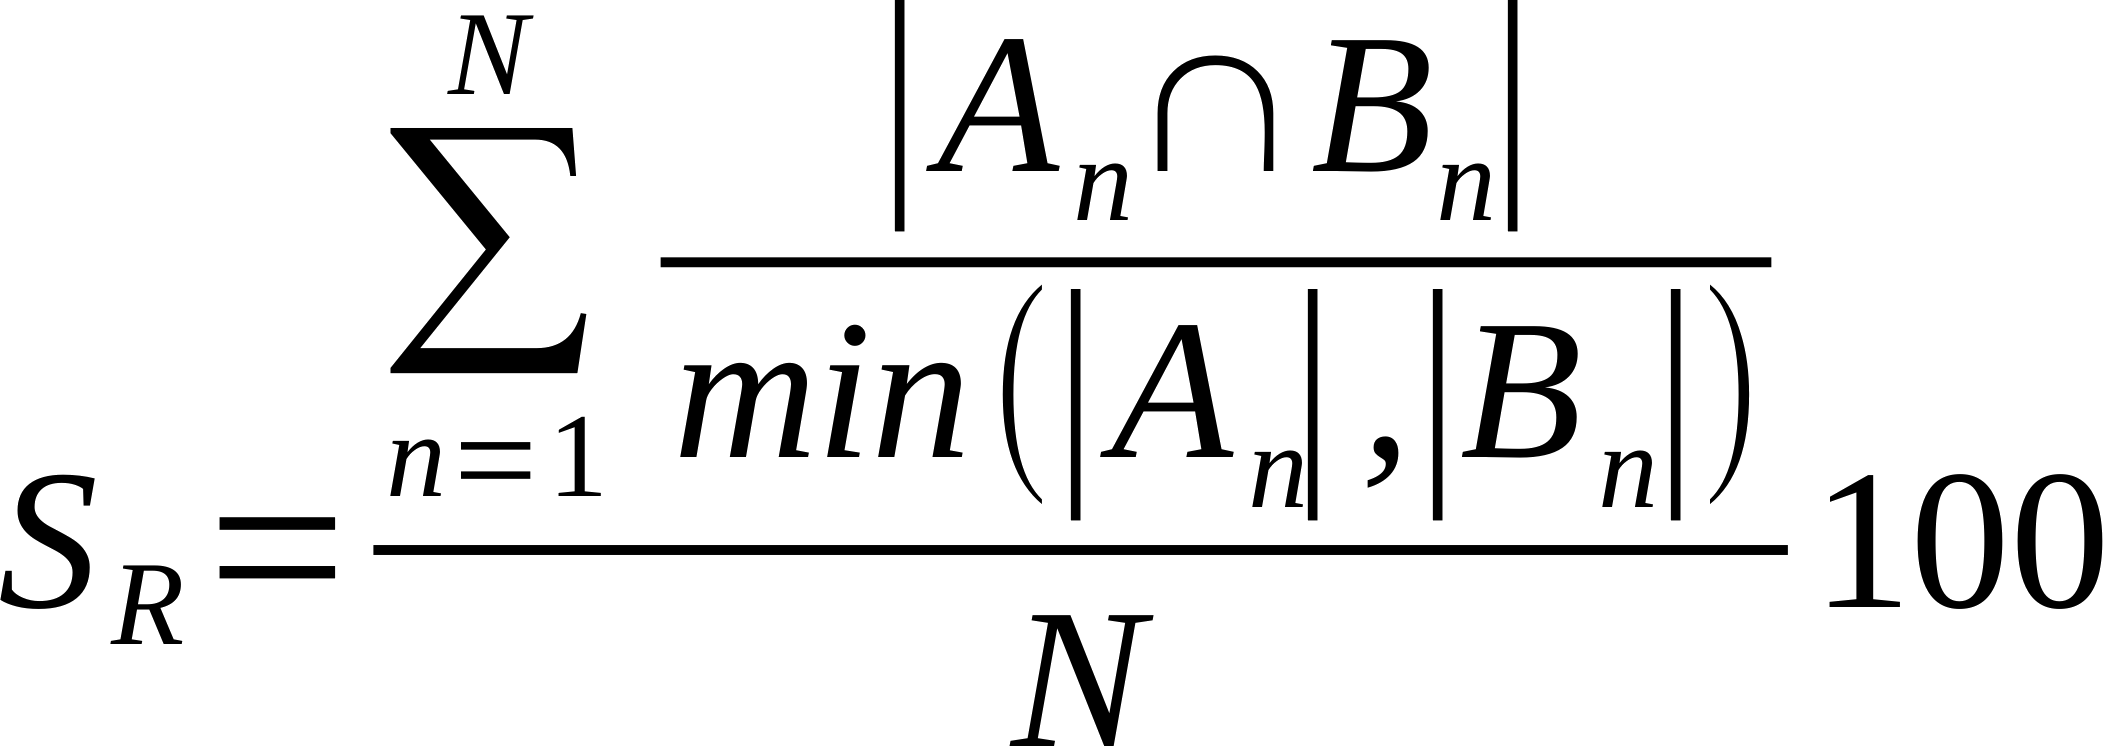
|
| Average % Shared Cliques (k3-6) |
Is the average of the ratio of the intersection over union of k=3, k=4, k=5, and k=6 cliques.
Where Ak and Bk are k-cliques in in network A and B, respectively. 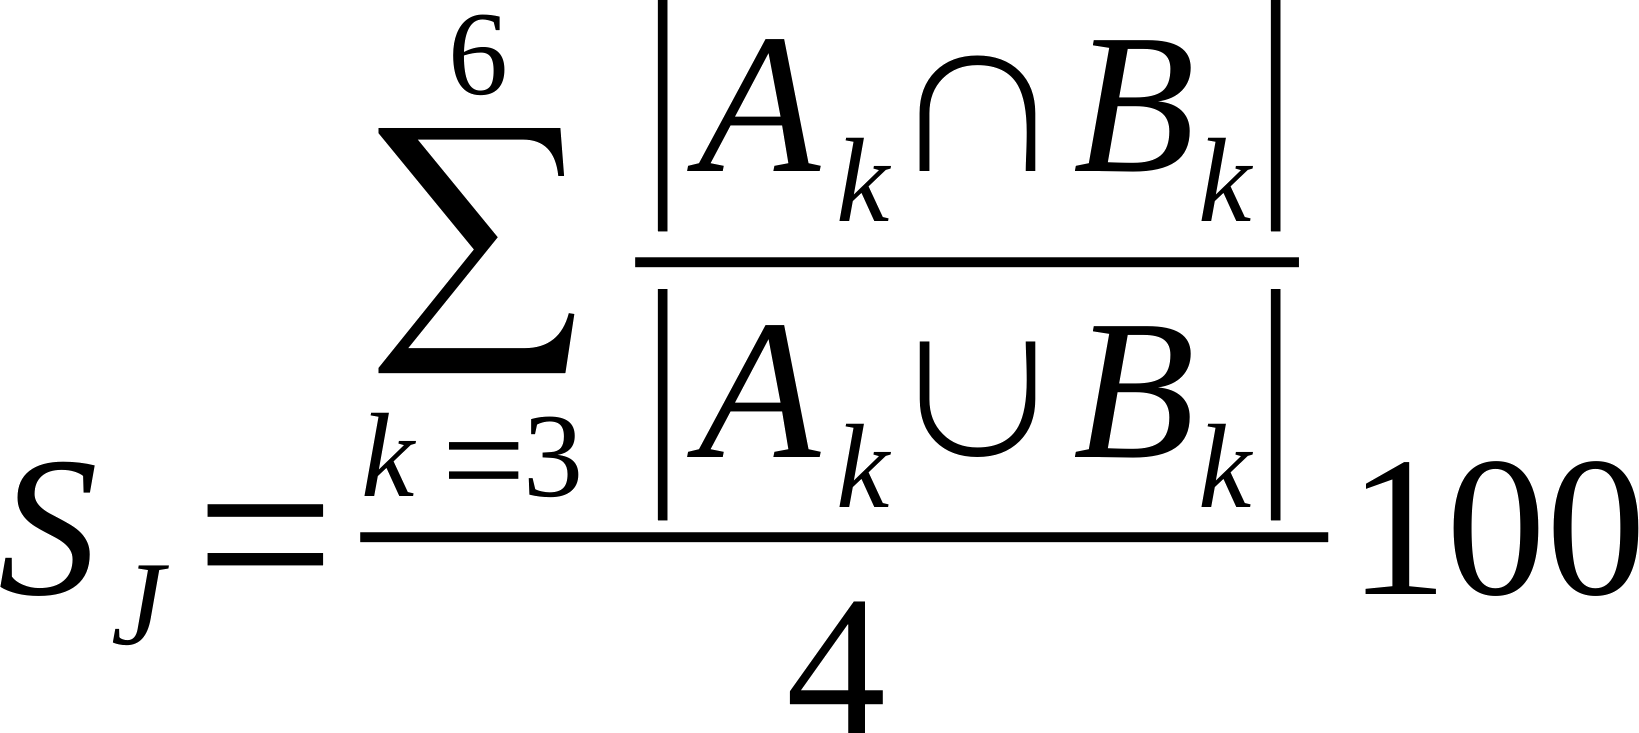
|
| Graphlets Similarity | Is the Graphlet Degree Distribution Agreement calculated comparing in the two network the distribution of Graphlets small, connected, non-isomorphic subgraphs [23]. |
| Path Summary | |
|---|---|
| Number Of Nodes in Metapath | Total number of nodes in the global/filtered metapath. |
| Number Of Links Metapath | Total number of links in the global/filtered metapath. |
| Number of Shortest Paths | Total number paths in the global/filtered paths pool. |
| Length Of Smallest Path | Number of nodes in the shortest path. |
| Average Path Length | Average number of nodes in the global/filtered paths pool. |
| Length of Longest Path | Number of nodes in the longest path. |
| Minimum Path Strength | Lowest average interaction strength of links in the global/filtered path pool. |
| Average Path Strength | Average of the average interaction strengths of links in the global/filtered path pool. |
| Maximum Path Strength | Highest average interaction strength of links in the global/filtered path pool. |
| Minimum Path Correlation | Lowest average motion correlation between each node and the two extreme nodes in a path in the global/filtered path pool. |
| Average Path Correlation | Average of the average motion correlations between each node and the two extreme nodes in a path in the global/filtered path pool. |
| Maximum Path Correlation | Highest average motion correlation between each node and the two extreme nodes in a path in the global/filtered path pool. |
| Minimum % Of Corr. Nodes | Lowest percentage of internal nodes with a motion correlation ≥ the cutoff with one or both the two extremities in a path in the global/filtered path pool. |
| Average % Of Corr. Nodes | Average percentage of internal nodes with a motion correlation ≥ the cutoff with one or both the two extremities in a path in the global/filtered path pool. |
| Maximum % Of Corr. Nodes | Highest percentage of internal nodes with a motion correlation ≥ the cutoff with one or both the two extremities in a path in the global/filtered path pool. |
| Minimum Path Hubs % | Lowest percentage of hubs in the global/filtered path pool. |
| Average Path Hubs % | Average percentage of hub nodes present in the global/filtered paths pool. |
| Maximum Path Hubs % | Highest percentage of hubs in the global/filtered path pool. |
Documentation → References
- Felline A, Seeber M, Fanelli F. (2022) PSNtools for standalone and web-based structure network analyses of conformational ensembles. Comput Struct Biotechnol J. 2022 Jan 7;20:640-649. 10.1016/j.csbj.2021.12.044.
- Felline A, Seeber M, Fanelli F (2020) webPSN v2.0: a webserver to infer fingerprints of structural communication in biomacromolecules. Nucleic Acids Res.
- Raimondi F, Felline A, Seeber M, Mariani S, Fanelli F (2013) A Mixed Protein Structure Network and Elastic Network Model Approach to Predict the Structural Communication in Biomolecular Systems: The PDZ2 Domain from Tyrosine Phosphatase 1E As a Case Study. J Chem Theory Comput 9: 2504-2518.
- Fanelli F, Felline A (2013) Network Analysis to Uncover the Structural Communication in GPCRs. Methods Cell Biol 117: 43-61.
- Raimondi F, Felline A, Fanelli F (2015) Catching Functional Modes and Structural Communication in Dbl Family Rho Guanine Nucleotide Exchange Factors. J Chem Inf Model 55: 1878-1893.
- Fanelli F, Felline A, Raimondi F, Seeber M (2016) Structure network analysis to gain insights into GPCR function. Biochem Soc Trans 44: 613-618.
- Felline A., Ghitti M., Musco G., Fanelli F. (2017) Dissecting intrinsic and ligand-induced structural communication in the β3 headpiece of integrins. Biochim Biophys Acta Gen Subj 1861: 2367-2381.
- Felline A, Mariani S, Raimondi F, Bellucci L, Fanelli F (2016) Structural determinants of Constitutive Activation of Gα proteins: Transducin as a Paradigm. J J Chem Theory Comput 13: 886-899.
- Behnen P, Felline A, Comitato A, Di Salvo MT, Raimondi F, Gulati S, Kahremany S, Palczewski K, Marigo V, Fanelli F. (2018). A small chaperone improves folding and routing of rhodopsin mutants linked to inherited blindness. IScience 4: 1-19.
- Felline A, Belmonte L, Raimondi F, Bellucci L, Fanelli F (2019) Interconnecting Flexibility, Structural Communication, and Function in RhoGEF Oncoproteins. J. Chem. Inf. Model. 59: 4300-4313.
- Konagurthu AS, Whisstock JC, Stuckey PJ, Lesk AM (2006) MUSTANG: a multiple structural alignment algorithm. Proteins 64: 559-574.
- Wang S, Peng J, Xu J (2011) Alignment of distantly related protein structures: algorithm, bound and implications to homology modeling. Bioinformatics 27: 2537-2545.
- Sievers F, Higgins DG (2014) Clustal Omega, accurate alignment of very large numbers of sequences. Methods Mol Biol. 1079: 105-116.
- Ge P, Zhang S (2015) STAR3D: a stack-based RNA 3D structural alignment tool. Nucleic Acids Res. 43: e137.
- Ritchie DW (2016) Calculating and scoring high quality multiple flexible protein structure alignments. Bioinformatics 32: 2650-2658.
- Brinda KV, Vishveshwara S (2005) A network representation of protein structures: implications for protein stability. Biophys J 89: 4159-4170.
- Van Wynsberghe A.W., Cui Q. (2006) Interpreting correlated motions using normal mode analysis. Structure 14: 1647-1653.
- Seeber M, Felline A, Raimondi F, Muff S, Friedman R, Rao F, Caflisch A, Fanelli F (2011) Wordom: A user-friendly program for the analysis of molecular structures, trajectories, and free energy surfaces. J Comput Chem 32: 1183-1194.
- Dijkstra E.W. (1959) A Note on Two Problems in Connexion with Graphs. Numer. Math. 1: 269-271.
- Jaccard, P. (1912) The distribution of the flora in the alpine zone. New Phytologist, 11: 37-50.
- Cluster Analysis for Researchers. By H. Charles Romesburg. (Belmont, Calif.: Lifetime Learning Publications, 1984. Pp. xiii 334). (1984). American Political Science Review, 78(4), 1211-1211.
- Vijaymeena, M. K.; Kavitha, K. (2016) A Survey on Similarity Measures in Text Mining. Machine Learning and Applications. 3 (1): 19–28.
- Przulj, N. (2007) Biological network comparison using graphlet degree distribution. Bioinformatics 23, 177–183.
- Isberg V., de Graaf C., Bortolato A., Cherezov V., Katritch V., Marshall F.H., Mordalski S., Pin J.P., Stevens R.C., Vriend G., Gloriam D.E. Generic GPCR residue numbers - aligning topology maps while minding the gaps. Trends Pharmacol. Sci., 2015, 36:22-31.
- Ashkenazy H., Abadi S., Martz E., Chay O., Mayrose I., Pupko T., and Ben-Tal N. (2016) ConSurf 2016: an improved methodology to estimate and visualize evolutionary conservation in macromolecules. Nucl. Acids Res., 44, W1, 2016, Pages W344-W350.
How To Cite & Contact Us
|
Thank you for using psnGPCR, we really appreciate it. Please, remember to cite the following paper in all published works which utilize this webserver: Angelo Felline, Sara Gentile and Francesca Fanelli psnGPCRdb: the structure-network database of G Protein Coupled Receptors Journal of Molecular Biology, 2023 https://doi.org/10.1016/j.jmb.2023.167950
Angelo Felline, Michele Seeber and Francesca Fanelli PSNtools for standalone and web-based structure network analyses of conformational ensembles Computational and Structural Biotechnology Journal, 7 January 2022 https://doi.org/10.1016/j.csbj.2021.12.044
|
You can share our database with the following QR Code: 
|
If you have any questions or have encountered any problems with this web server please do not hesitate to contact us at the following email address:
WebPSN
We strive to keep our database as complete and up-to-date as possible, but:
- if you cannot find the receptor you are looking for or
- if you want to further analyze the communication pathways selecting specific residue pairs or
- if want to calculate a PSN difference not present in our selected list or
- if want to calculate a Consensus PSN not present in our selected list
you can use our free WebPSN webserver following the link below
WebPSN
Server Statistics
| Total Number Of DB Entries | 4937 |
| Total Number Of Single Networks | 3532 |
| ↳ Class A | 2861 |
| ↳ Class B1 | 321 |
| ↳ Class B2 | 88 |
| ↳ Class C | 163 |
| ↳ Class D1 | 6 |
| ↳ Class F | 46 |
| ↳ Class O1 | 9 |
| ↳ Class O2 | 8 |
| ↳ Class T | 30 |
| Total Number Of Differences | 160 |
| Total Number Of Consensuses | 567 |
| Total Number Of Ligands | 678 |
| Total Number Of Visits | 969770 |
| Visited Single Network Pages | 634899 |
| Visited Difference Pages | 45203 |
| Visited Consensus Pages | 201786 |
| Visited Ligand Pages | 105880 |
| Searched Ligands | 2604 |
| Last DB Update | 2026-03-05 |
Help
Use the above menu bar to navigate this web site and the dropdown menus marked with a down facing triangle (▼) to access the various sections of the database.
In more detail:
Home:
This is the web-site home page with a brief description of its purpose and scientific importance.
Docs:
In this section you can find several links to in-depth documentation about psnGPCRdb database, the theory behind the mixed PSN-ENM approach, a detailed description of output summary tables and a comprehensive list of bibliographic references.
Receptors:
The access point to the networks of individual receptors, to a selection of their network differences as well as to a selection of interesting network consensuses.
Dimers:
Networks of homodimeric/heterodimer receptors.
G Proteins:
Single and consensus networks of receptors coupled to their G Proteins.
Other Proteins:
Networks of receptors coupled to arrestins or kinases.
Ligands:
Info & stats concerning the ligands present in our database.
WebPSN:
A direct link to our WebPSN server that can be used to further analyse network data extracted from psnGPCRdb database.
Cite & Contacts:
Citing psnGPCRdb in all published works which utilize this database is the best way to help us move forward. In this section you can find the proper way to cite psnGPCRdb and you can also download citation files for several reference management software. This section also offers a simple to use form to reach out to us.
Stats:
This section reports some statistics about psnGPCRdb database and its usage.
Help:
This help page.