Welcome
Welcome
webPSN is a free web server for high throughput investigation of allosterism in biological systems, which employs a mixed Protein Structure Network (PSN) and Elastic Network Model-Normal Mode Analysis (ENM-NMA), i.e. PSN-ENM, strategy to investigate the structural communication in proteins and nucleic acids [1-7, 10].
The PSN analysis in general and the PSN-ENM approach in particular proved as valuable tools in a number of studies [1-10]. The webPSN server provides the user with a friendly interface and an immediate feedback through graphical visualizations of the output. Automation and high speed makes this web server suitable for high throughput investigation of the communication pathways in large sets of biomolecular systems in different functional states.
This new version of webPSN server introduces several novelties:
- calculation of the differences between two networks
- calculation of a consensus from a pool of networks (e.g. a structure network signature of homologous or analogous systems)
- extension of PSN analyses from proteins to nucleic acids and protein-nucleic acid complexes
- a periodically updated internal database of ~ 30,000 pre-calculated normalization factors for non aminoacid molecules in the PDB
- automatic calculation of the normalization factors of novel molecules not included in the internal database
- high quality and publication-ready plots and 3D outputs (as PyMol and VMD scripts)
- improved calculation speed and accuracy
Download
Download
In order to use PSNTools, you also need to install Wordom, our software for structure and molecular dynamics simulations analysis.
Click here to download only PSNTools Source Code (to be compiled)
Use the links below to download PSNTools and PSNToolsGUI user guides
PSNTools User Guide (command line version) (PDF)
PSNToolsGUI User Guide (graphical user interface) (PDF)
This is a list of additional recommended software that, while not strictly necessary, are however highly recommended
Please, refer to your operating system manual and to the website of each software for more details about the installation process:
Stats
Server Statistics
| Total Submitted Jobs | 49128 |
| Submitted Single Net Jobs | 36909 |
| Submitted Nets Difference Jobs | 6628 |
| Submitted Nets Consensus Jobs | 5583 |
| Total Generated Labels | 123029 |
| Last Submission | Monday 03-08-2026 @ 09:47:44 |
| Average Network Size | 292.50 nodes |
| Average Calculation Time | 305.66 sec |
Contacts
Contact Us
If you have any questions or if you encounter any problems with this server please do not hesitate to contact us at the following email address:
Retrieve
Retrieve
Insert the job Id code in the space below and click retrieve button to load your results page
Please note that job Id codes are case sensitive (i.e. abcdef and abCdef are two different codes)
Example Runs
Example Runs
Example Runs
Example Runs
Example Runs
Example Runs
Cite
How To Cite
Thank you for using webPSN, we really appreciate it
Please, remember to cite at least one of the following papers in all published works which utilize this webserver:
Angelo Felline, Michele Seeber and Francesca Fanelli
PSNtools for standalone and web-based structure network analyses of conformational ensembles
Computational and Structural Biotechnology Journal, 7 January 2022
https://doi.org/10.1016/j.csbj.2021.12.044
Angelo Felline, Michele Seeber and Francesca Fanelli
webPSN v2.0: a webserver to infer fingerprints of structural communication in biomacromolecules
Nucleic Acids Res, Web Server Issue, 19 May 2020
https://doi.org/10.1093/nar/gkaa397
Michele Seeber, Angelo Felline, Francesco Raimondi, Simona Mariani, Francesca Fanelli
webPSN: a web server for high-throughput investigation of structural communication in biomacromolecules
Bioinformatics, Volume 31, Issue 5, 1 March 2015, Pages 779–781
https://doi.org/10.1093/bioinformatics/btu718
Example Runs
Example Runs
Follow the step-by-step tutor pages to obtain the results of the three case studies presented in the paper or go directly to the precalculated results
PDB Submission
| Single PSN | step-by-step submission | example output | PSN Difference | step-by-step submission | example output | Consensus PSN | step-by-step submission | example output | Label Generator | step-by-step submission | example output |
 Trj Submission
| Single PSN | step-by-step submission | example output | PSN Difference | step-by-step submission | example output | Consensus PSN | step-by-step submission | example output | Label Generator | step-by-step submission | example output |
General Intro
The webPSN web server employs a mixed Protein Structure Network (PSN) and Elastic Network Model-Normal Mode Analysis (ENM-NMA)-based strategy to investigate allosterism in biological systems [1,2]. PSN is used to compute the interaction strengths and connectivities among nodes while ENM-NMA provides information on system’s dynamics, which serves to compute the cross-correlation of atomic motions for path filtering. The method is hereafter indicated as PSN-ENM.
In synthesis, the first step in the PSN-ENM approach consists in performing the PSN analysis on a single high resolution structure, which serves to derive the network components (e.g. nodes, links, hubs, communities). Nodes interconnectivities represent also the basis to search for all possible shortest communication paths between all nodes in the network. The shortest paths are then filtered out according to the cross-correlation of atomic motions derived from ENM-NMA resulting in a reduced pool of paths composed of highly correlated nodes. Finally, a global metapath made of the most recurrent links in the shortest path pool is computed to infer a coarse picture of the structural communication in the considered system. Single paths can be inferred as well by providing a single node pair as an input of path search.
The first version of webPSN server was designed to compute only Single-structure PSN-ENM analyses. Important novelties concern the possibility to: a) compare Protein Structure Graphs (PSGs) (e.g. nodes, hubs, and links) or metapaths computed on two structures (i.e. difference network) and b) infer links, hubs, communities, and metapaths from consensus networks computed on a set of homologous or analogous systems. Computation of consensus network allows to infer common structural communication features in proteins sharing the same functionality [1, 2, 5, 7, 9] or even sharing only the fold. On the other hand, computation of difference network is particularly useful to infer commonalties and differences in the structural communication of two functionally different states of the same protein either induced by ligand or mutation [1, 2, 6, 7].
The updated version deals not only with proteins but also with nucleic acids and protein-nucleic acid complexes.
Difference and consensus network computations rely on a unique positional labeling and the server provides different options for this task: from a fully automated approach, based on the structural and/or sequence alignment performed by external, state of the art, software [10-14], which does not require any user intervention, to a fully customizable labeling syntax for advanced users.
The webPSN server produces high quality and publication-ready plots and 3D outputs, as PyMol and VMD scripts, as well as a number of easy-to-access data files. Additionally, all these outputs are conveniently zipped for download.
Back to Docs
Selection Syntax
Appendix A: Selection Syntax
webPSN adopts a modified version of the selection syntax used in Wordom .
This syntax employs a string structured as follows:
/chain/segment/residues
Note: a segment is the 12th field in the pdb (3rd after coordinates). It is a 4-character field, which must not be confused with the chain (single-character) field after the residue-type in the pdb (5th field).
Wild cards such as * (any number of any character), ? (any single character), [abc] (any single character among a, b and c) and [!abc] (any single character except a, b and c) are supported. Ranges can also be defined using - character.
Syntax       Meaning
/*/*/*       selects all residues in all chains and segments (can be omitted, applied by defualt)
/C/S/*       selects all residues in chain C and segment S
/C/S/135     selects only residue 135 from chain C and segment S
/C/S?/*/*    selects all residues in chain C and segment S1, SB, SC ...
/C/S[AB]/*   selects all residues in chain C and segment SA, SB
/C/S/1-326   selects all residues in the range 1-326 (terminals included) from chain C and segment S
Ranges can be concatenated using the | character
Syntax               Meaning
/C/S/1-10|15|20-30   selects the following residues from chain C and segment S:
                     from 1 to 10, 15 and from 20 t0 30
Finally, several selections can be concatenated using the ; character
Syntax                               Meaning
/A/Q/* ; /B/W/1-10|15 ; /G/E/20-30   selects all residues from chain A and segment Q
                                     residues from 1 to 10 and 15 from chain B and segment W and
                                     residues from 20 to 30 from G and segment E
Back to topExternal Values Files
Appendix B: External Values Files
The user can, optionally, provide numerical values to be associated with any number of residues (e.g. conservation scores, mutation effect, etc.). If provided, these values will appear in the output tables (column OutVal) and the user will be able to search and sort output tables on the basis of these values.
The user can submit external values using one of the following file formats:
-
A text file with 2 columns per line, one residue definition and one numerical value separated by at least one space or tab character, as in the following excerpt:
...
C:S:Y10   7
C:S:V11   7
C:S:P12   5
C:S:F13   6
C:S:S14   4
C:S:N15   7
C:S:?100  5
...
Residues are defined using the following syntax:Chain:Segment:ResTypeResNum
Please use one-letter codes for standard amino acids (e.g. P for proline, Y for tyrosine, etc) and the following lower case one-letter codes for standard nucleotides:
Base Code A, DA a C, DC c G, DG g DT t U u Use ? character for any other molecule present in your pdb.
- A csv (comma-separated) file with 2 columns per line. The same rules for the residue definition listed above apply to this format. A csv file can be created using common spreadsheet software (e.g. LibreOffice Calc, MS Excel and Google Sheets).
- ConSurf conservation scores. The user can directly submit the consurf.grades output file generated by the ConSurf server without any modification. Please, note that the COLOR column will be used and not the SCORE (i.e. the 5th column after the header and not the 4th one).
Note: When used in difference and consensus networks, the values refer to the selected reference structure and will be applied to all other networks using labels.
Back to topLabels Files
Appendix C: Label Files
When calculating the difference between two networks or a consensus among a pool of networks it is of fundamental importance to unambiguously identify structurally equivalent residues/nucleotides among processed proteins/nucleic acids. A unique identifier, called label, is then associated to these equivalent residues/nucleotides so that their interactions can be compared among the analyzed networks.This server provides four options for this task:
- Label generation using the provided assisted tool (recomended)
- User-submitted label files
- Automatic label generation by structural/sequence alignment software
- Label generation on the basis of a user submitted multi sequence alignment
Although the compilation of label files may require a considerable amount of time depending on the size and number of analyzed structures, label files provide the user with a full control of the labeling process.
The format of a label file is quite similar to the one used in external values files: a text file with 2 columns per line, one-residue definition and one label separated by at least one space or tab character, as in the following excerpt:... C:S:Y10 Tyr10 C:S:V11 Val11 C:S:P12 Pro12 C:S:F13 Phe13 C:S:S14 Ser14 ...Residues are indicated using the following syntax:
Chain:Segment:ResTypeResNum
Please use one-letter codes for standard amino acids (e.g. P for proline, Y for tyrosine, etc) and the following lower case one-letter codes for standard nucleotides:
| Base | Code |
|---|---|
| A, DA | a |
| C, DC | c |
| G, DG | g |
| DT | t |
| U | u |
Use ? character for any other molecule present in your pdb.
...
C:S:?100   Ligand
...
A label can be a combination of any length of upper and lower case letters (A-Z, a-z), digits (0-9) and all other printable symbols (e.g. !, @, % etc) with the only two exceptions of # and - characters. Back to top
Summary Tables
Appendix D: Description of Summary Tables
| Net Summary | |
|---|---|
| Imin | The minimum interaction strength needed to connect two nodes. More details about this value and how it is calculated can be found in the PSN section of the theory page. |
| Number of Linked Nodes | Total number of nodes with at least one link. |
| Number of Links | Total number of links with an interaction strength ≥ Imin. Links with a lower value may have been added to avoid excessive network fragmentation. More details about links with a sub-Imin interaction strength can be found in the PSN section of the theory page. |
| Number of Hubs | Total number of nodes with at least 4 links. More details about this cutoff can be found in the PSN section of the theory page. |
| Number of Links mediated by hubs | Total number of links mediated by hubs. |
| Number of Communities | Total number of communities. Communities are sets of highly interconnected nodes that can be viewed as fairly independent compartments of a graph. You can find a more detailed explanation of what a community is and how it is identified in the PSN section of the theory page. |
| Number of Nodes involved in Communities | Total number of nodes in a community. |
| Number of Links involved in Communities | Total number of links in a community. |
| Network Similarities | |
|---|---|
| Average % Shared Neighbours (Jaccard) | Is the average of the ratio of the intersection over union of each node links.
Where n is a given node in network A and B, and An and Bn are the links of node n in network A and B, respectively [20]. 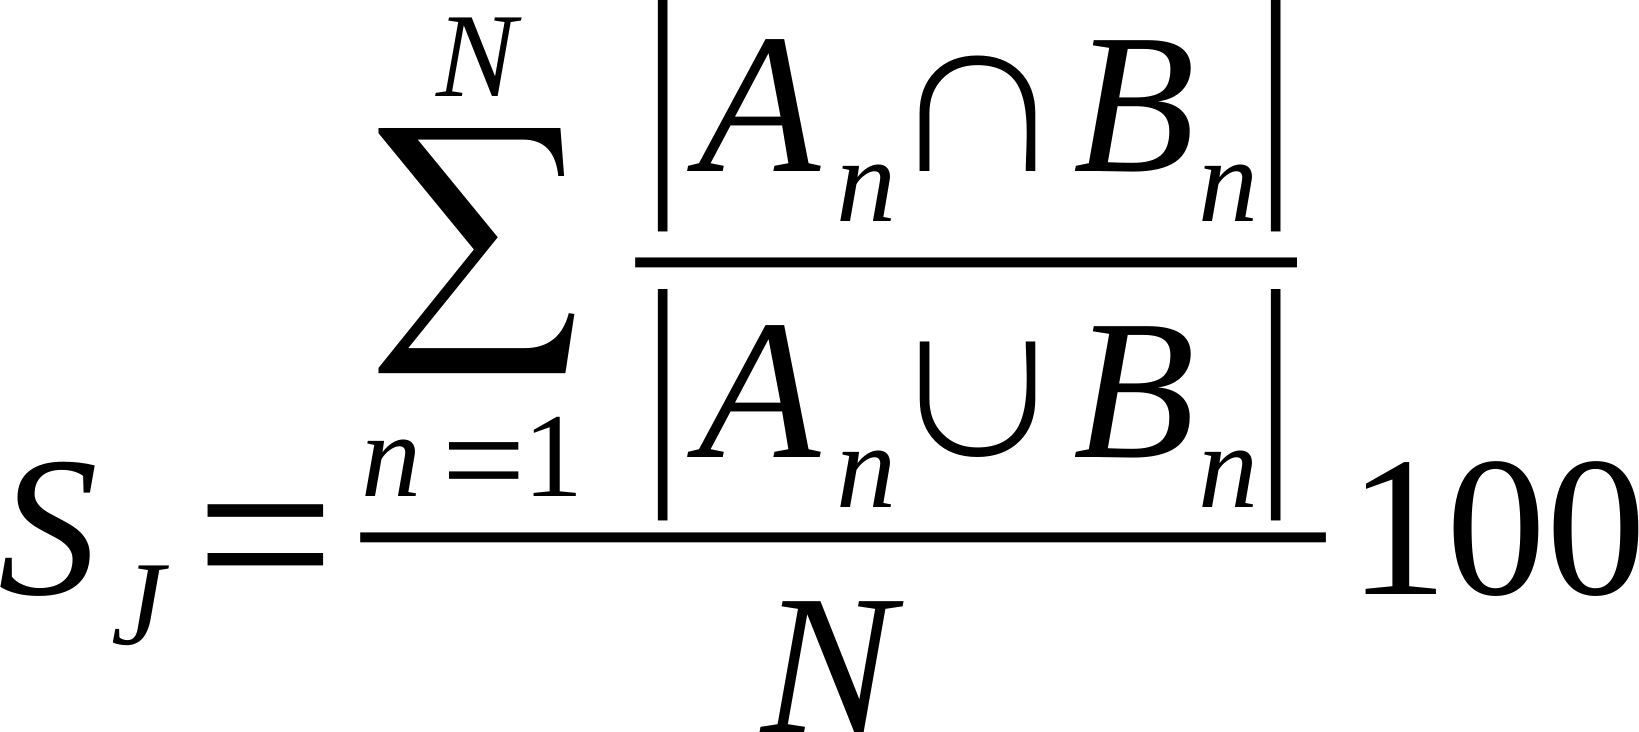
|
| Average % Shared Neighbours (Otsuka version of cosine similarity) | Is the average of the ratio of the intersection over the square root of the product of the number of links made by each node in compared networks..
Where n is a given node in network A and B, and An and Bn are the links of node n in network A and B, respectively [21]. 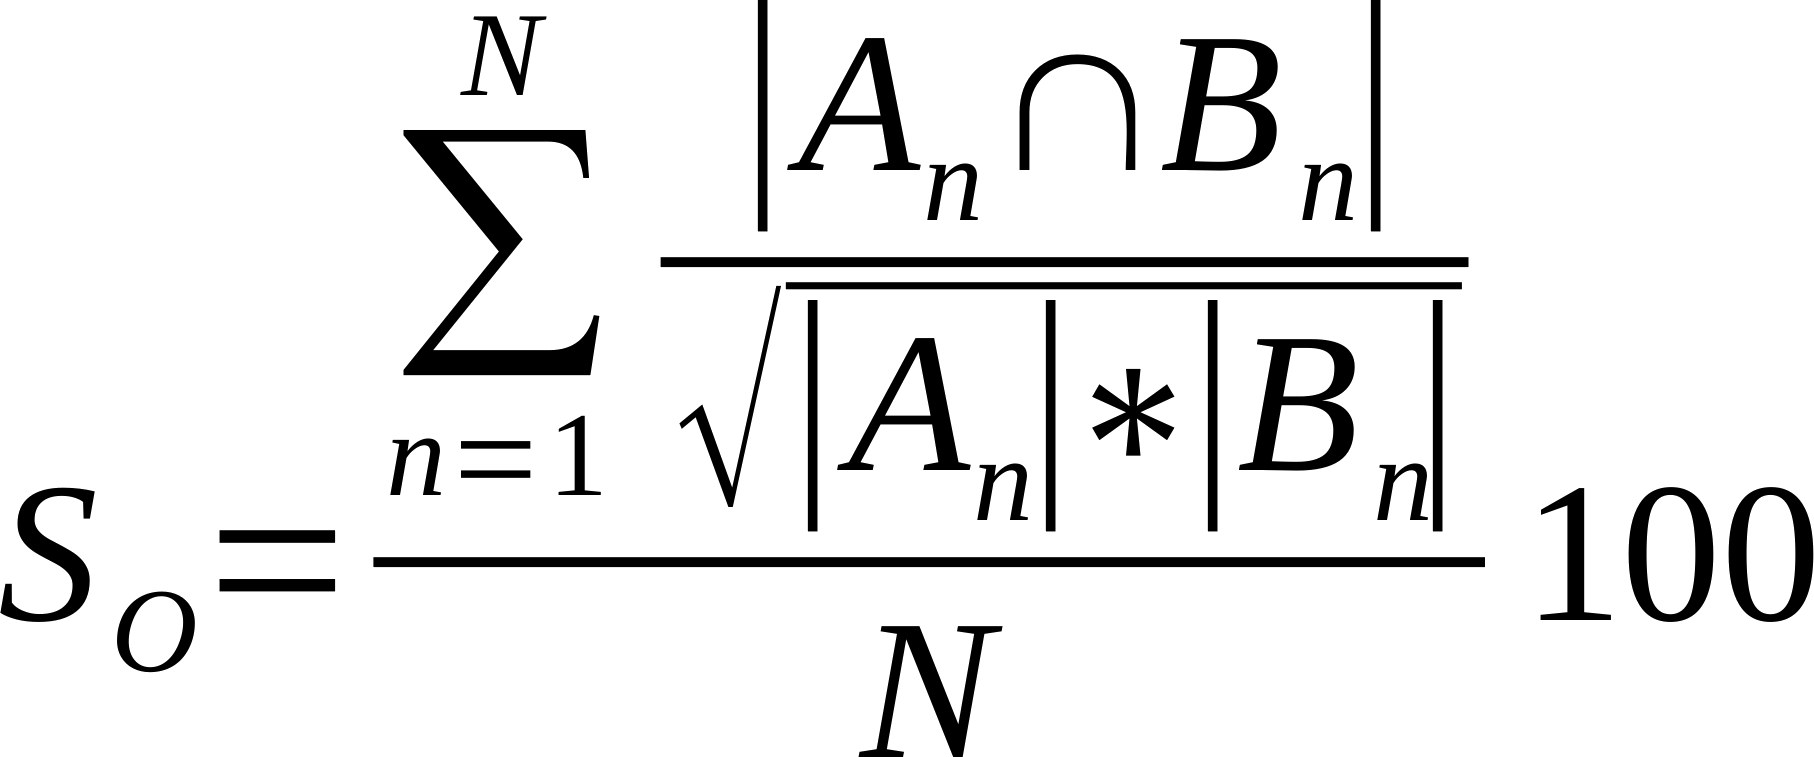
|
| Average % Shared Neighbours (Overlap Coefficient) | Is the average of the ratio of the intersection over the smaller list of links made by each node. Also known as overlap coefficient.
Where n is a given node in network A and B, and An and Bn are the links of node n in network A and B, respectively [22]. 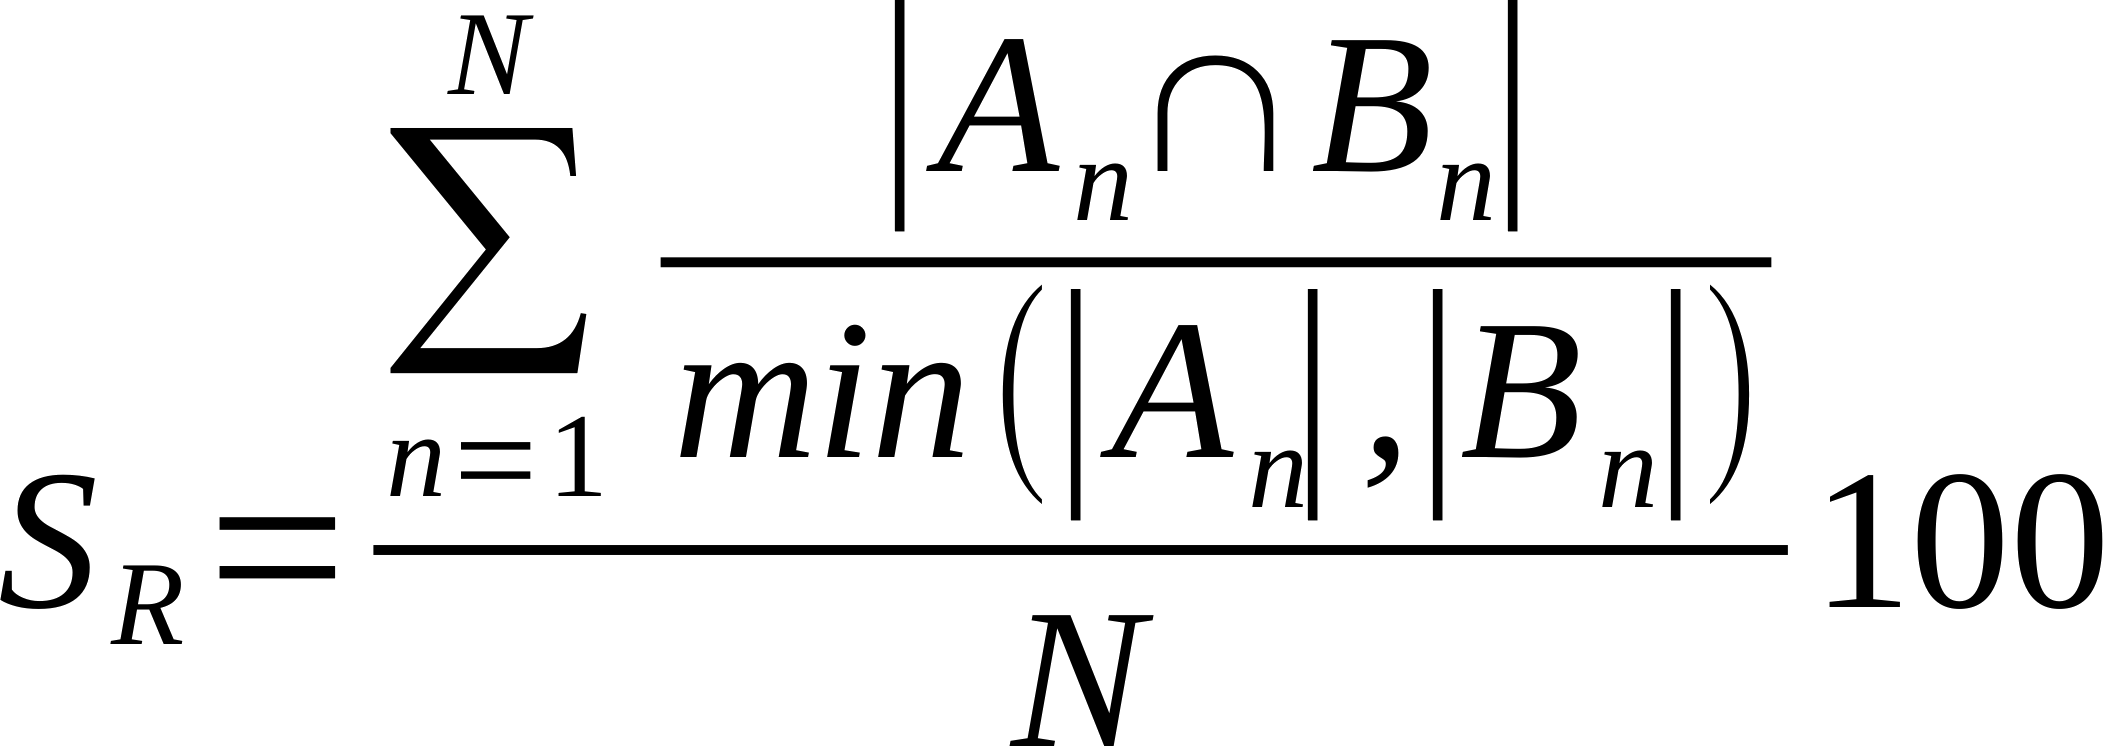
|
| Average % Shared Cliques (k3-6) | Is the average of the ratio of the intersection over union of k=3, k=4, k=5, and k=6 cliques.
Where Ak and Bk are k-cliques in in network A and B, respectively. 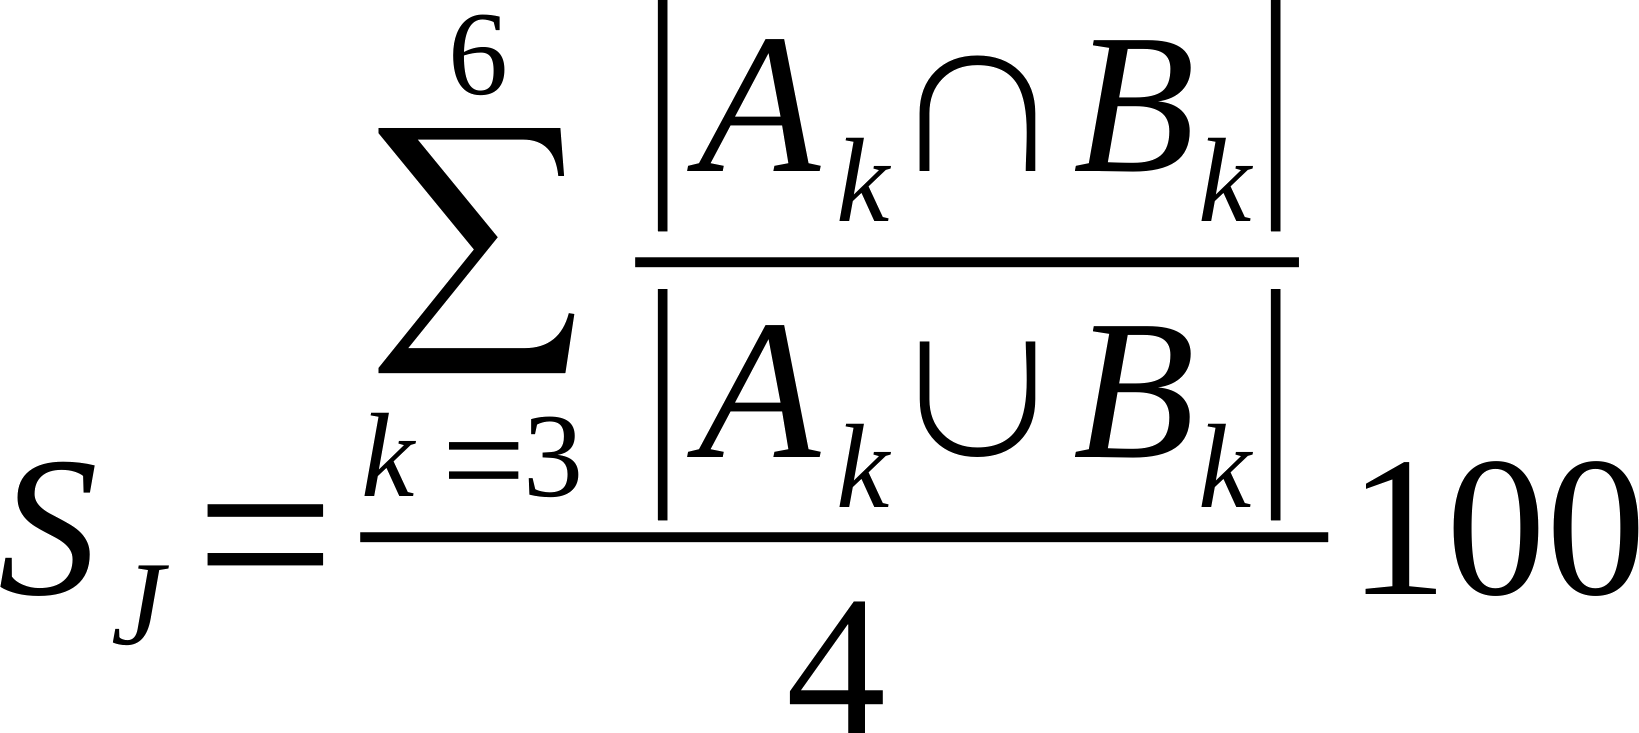
|
| Graphlets Similarity | Is the Graphlet Degree Distribution Agreement calculated comparing in the two network the distribution of Graphlets small, connected, non-isomorphic subgraphs [23]. |
| (Filtered) Path Summary | |
|---|---|
| Number Of Nodes in Metapath | Total number of nodes in the global/filtered metapath. |
| Number Of Links Metapath | Total number of links in the global/filtered metapath. |
| Number of Shortest Paths | Total number paths in the global/filtered paths pool. |
| Length Of Smallest Path | Number of nodes in the shortest path. |
| Average Path Length | Average number of nodes in the global/filtered paths pool. |
| Length of Longest Path | Number of nodes in the longest path. |
| Minimum Path Force | Lowest average interaction strength of links in the global/filtered path pool. |
| Average Path Force | Average of the average interaction strengths of links in the global/filtered path pool. |
| Maximum Path Force | Highest average interaction strength of links in the global/filtered path pool. |
| Minimum Path Correlation | Lowest average motion correlation between each node and the two extreme nodes in a path in the global/filtered path pool. |
| Average Path Correlation | Average of the average motion correlations between each node and the two extreme nodes in a path in the global/filtered path pool. |
| Maximum Path Correlation | Highest average motion correlation between each node and the two extreme nodes in a path in the global/filtered path pool. |
| Minimum % Of Corr. Nodes | Lowest percentage of internal nodes with a motion correlation ≥ the cutoff with one or both the two extremities in a path in the global/filtered path pool. |
| Average % Of Corr. Nodes | Average percentage of internal nodes with a motion correlation ≥ the cutoff with one or both the two extremities in a path in the global/filtered path pool. |
| Maximum % Of Corr. Nodes | Highest percentage of internal nodes with a motion correlation ≥ the cutoff with one or both the two extremities in a path in the global/filtered path pool. |
| Minimum Path Hubs % | Lowest percentage of hubs in the global/filtered path pool. |
| Average Path Hubs % | Average percentage of hub nodes present in the global/filtered paths pool. |
| Maximum Path Hubs % | Highest percentage of hubs in the global/filtered path pool. |
Summary Tables
Appendix E: Trajectory Statistic Plots
| CorrPairs | Distribution of correlated node pairs. |
| Links | The total number of links in each trajectory frame. |
| Hubs | The total number of hubs in each trajectory frame. |
| HLinks | The total number links mediated by at least one hub in each trajectory frame. |
| CommsNum | The total number of communities in each trajectory frame. |
| CommsNodes | The total number of community nodes in each trajectory frame. |
| CommsLinks | The total number of community links in each trajectory frame. |
| CommsHubs | The total number of community hubs in each trajectory frame. |
| CommsHLinks | The total number of community links mediated by at least one hub in each trajectory frame. |
| Comm1Nodes | The total number of nodes in the largest community in each trajectory frame. |
| Comm1Links | The total number of links in the largest community in each trajectory frame. |
| Comm1Hubs | The total number of hubs in the largest community in each trajectory frame. |
| Comm1Links | The total number of links mediated by at least one hub in the largest community in each trajectory frame. |
| Comm2Nodes | The total number of nodes in the 2nd largest community in each trajectory frame. |
| Comm2Links | The total number of links in the 2nd largest community in each trajectory frame. |
| Comm2Hubs | The total number of hubs in the 2nd largest community in each trajectory frame. |
| Comm2Links | The total number of links mediated by at least one hub in the 2nd largest community in each trajectory frame. |
| Comm3Nodes | The total number of nodes in the 3rd largest community in each trajectory frame. |
| Comm3Links | The total number of links in the 3rd largest community in each trajectory frame. |
| Comm3Hubs | The total number of hubs in the 3rd largest community in each trajectory frame. |
| Comm3Links | The total number of links mediated by at least one hub in the 3rd largest community in each trajectory frame. |
| Comm123Nodes | The total number of nodes in the 3 largest communities in each trajectory frame. |
| Comm123Links | The total number of links in the 3 largest communities in each trajectory frame. |
| Comm123Hubs | The total number of hubs in the 3 largest communities in each trajectory frame. |
| Comm123Links | The total number of links mediated by at least one hub in the 3 largest communities in each trajectory frame. |
For each non standard aminoacids/nuclotides in your trajectory, the following statistics will also be present:
| LigNameLinks | The total number of links made by the ligand in each trajectory frame. |
| LigNameHLinks | The total number of links mediated by at least one hub and the ligand in each trajectory frame. |
| LigNameCommNodes | The total number of nodes present in the ligand community in each trajectory frame. |
| LigNameCommLinks | The total number of links present in the ligand community in each trajectory frame. |
| LigNameCommHubs | The total number of hubs present in the ligand community in each trajectory frame. |
| LigNameCommHLinks | The total number of links mediated by at least one hub present in the ligand community in each trajectory frame. |
| LigNameShellNodes | The total number of nodes in the interaction shell of the ligand in each trajectory frame. |
| LigNameShellLinks | The total number of links in the interaction shell of the ligand in each trajectory frame. |
| LigNameShellHubs | The total number of hubs in the interaction shell of the ligand in each trajectory frame. |
| LigNameShellHLinks | The total number of links mediated by at least one hub in the interaction shell of the ligand in each trajectory frame. |
where LigName is the label of a given non standard aminoacids/nuclotides
Back to topTheory
PSN
PSN analysis is a product of graph theory applied to protein and nucleic acid structures [4, 16]. A graph is defined by a set of vertices (nodes) and connections (edges) between them. In a PSN, each amino acid residue is represented as a node and these nodes are connected by edges based on the strength of non-covalent interactions between residues. The strength of interaction between residues i and j (Iij) is evaluated as a percentage given by equation 1:
| (1) |
where nij is the number of atom-atom pairs between the side chains of residues i and j within a distance cutoff of 4.5 Aring. Ni and Nj are normalization factors for residue types i and j, which account for the differences in size of the amino acid side chains and their propensity to make the maximum number of contacts with other amino acids in protein structures. Glycines, are now included in the PSN analysis. The webPSN server has an internal database with the normalization factors for the 20 standard amino acids and the 8 standard nucleotides (i.e. dA, dG, dC, dT, A, G, C, and U), as well as for more than 30,000 biologically relevant molecules and ions (ligands, lipids, sugars, etc) from the PDB. Additionally, the server automatically identifies un-parametrized molecules in the submitted PDB files and automatically calculates their normalization factors transparently.
Iij are calculated for all node pairs. At a given interaction strength cutoff, Imin, any residue pair ij for which Iij ≥ Imin is considered to be interacting and hence is connected. Node interconnectivity is used to highlight node clusters, where a cluster is a set of connected nodes in a graph. Cluster size, i.e., the number of nodes constituting a cluster, varies as a function of the Imin, and the size of the largest cluster is used to calculate the Icritic value. The latter is defined as the Imin, at which the size of the largest cluster is half the size of the largest cluster at Imin = 0.0%. Studies by Vishveshwara's [16] group found that optimal Imin corresponds to the one at which the largest cluster undergoes a transition. All resulting clusters are then iteratively connected by the link(s) with the highest sub-Icritic interaction strength to compensate, at least in part, for the lack of side chain fluctuations.
Theory - 2
Finally, for networks calculated from trajectories, a link is taken into consideration if it is present in at least 50% of the frames.
Residues making four or more edges are referred to as hubs at that particular Imin. Such cutoff for hub definition relates to the intrinsic limit in the possible number of non covalent connections made by an amino acid in protein structures due to steric constraints. The cutoff 4 is close to the upper limit. The majority of amino acid hubs indeed make from 4 to 6 links, with 4 being the most frequent value.
To avoid excessive network fragmentation, which would impair the search for shortest communication paths (see below), all clusters are iteratively connected by the link with the highest sub-Icritical interaction strength. Please note that in old versions, the interaction strengths were rounded to the second decimal place before checking for the link with the highest sub-Icritical strength. In the new version instead, the real unrounded value is used.
Finally, links are then used to highlight network communities, which are sets of highly interconnected nodes such that nodes belonging to the same community are densely linked to each other and poorly connected to nodes outside the community. Communities can be considered as fairly independent compartments of a graph. They are identified using a variant of the clique percolation method, by finding all the k=3-cliques, i.e. sets of three fully interconnected nodes, and then merging all those cliques sharing at least one node.
Back to topENM
The combination between a coarse grained representation of a protein structure (e.g. ENM) and Normal Mode Analysis (NMA) is ever increasingly used to study the collective dynamics of complex systems. ENM-NMA is a coarse grained normal mode analysis technique able to describe the vibrational dynamics of protein systems around an energy minimum. With this technique, each protein/nucleic acid structure is described by a reduced subset of atoms corresponding to the Cα-atoms, for standard amino acids, and the atom nearest to the geometric center for all other molecules.
The interactions between particle pairs are given by a single term Hookean harmonic potential. The total energy of the system is thus described by the simple Hamiltonian:
| (2) |
where dij and dij0 are the instantaneous and equilibrium distances between particle i and j, respectively, whereas kij is a force constant, defined as:
| (3) |
where C is constant (with a default value of 40 Kcal/mol ·Å2).
The cross-correlations of motions for path filtering are obtained from the covariance matrix C [17]:
| (4) |
where Cij denotes the correlation between particles i and j, M is the number of modes considered for computation (the first 10 non-zero frequency modes), νxy and λy are, respectively, the xth element and the associated eigenvalue of the yth mode.
All ENM-NMA calculations are performed by means of the latest realease of our Wordom software [18]
Back to topPath Search and Filtering
The search for all shortest paths relies on Dijkstra’s algorithm [19]. The method first finds all possible communication paths between all node pairs and then filters the results according to cross-correlation of atomic motions, as derived from ENM-NMA analysis.
Filtering consists in retaining only those shortest paths that contain only residues with a correlation ≥ 0.7 (for a network calculated from a pdb) and 0.8 (for a network calculated from a trajectory) with at least one of the two path extremities (i.e. the first and last amino acids in the path).
Finally, filtered paths were used to build the global meta path, which is made of the most recurrent links, i.e. those links present in a number paths ≥ 10% (for a network calculated from a pdb) and 20% (for a network calculated from a trajectory) of the number of paths in which the most recurrent link in present.
Such meta path represents a coarse/global picture of the structural communication in the considered system.
In the result page, the user can filter those paths that begin and end at a given residue pair or that pass through a residue. Such a path filtering provides a novel metapath and is particularly recommended when some information on residues involved in structural communication is available.
Back to topReferences
References
- Seeber M, Felline A, Raimondi F, Mariani S, Fanelli F (2015) webPSN: a web server for high-throughput investigation of structural communication in biomacromolecules. Bioinformatics 31: 779-781.
- Felline A, Seeber M, Fanelli F (2020) webPSN v2.0: a webserver to infer fingerprints of structural communication in biomacromolecules. Nucleic Acids Res.
- Raimondi F, Felline A, Seeber M, Mariani S, Fanelli F (2013) A Mixed Protein Structure Network and Elastic Network Model Approach to Predict the Structural Communication in Biomolecular Systems: The PDZ2 Domain from Tyrosine Phosphatase 1E As a Case Study. J Chem Theory Comput 9: 2504-2518.
- Fanelli F, Felline A (2013) Network Analysis to Uncover the Structural Communication in GPCRs. Methods Cell Biol 117: 43-61.
- Raimondi F, Felline A, Fanelli F (2015) Catching Functional Modes and Structural Communication in Dbl Family Rho Guanine Nucleotide Exchange Factors. J Chem Inf Model 55: 1878-1893.
- Fanelli F, Felline A, Raimondi F, Seeber M (2016) Structure network analysis to gain insights into GPCR function. Biochem Soc Trans 44: 613-618.
- Felline A., Ghitti M., Musco G., Fanelli F. (2017) Dissecting intrinsic and ligand-induced structural communication in the β3 headpiece of integrins. Biochim Biophys Acta Gen Subj 1861: 2367-2381.
- Felline A, Mariani S, Raimondi F, Bellucci L, Fanelli F (2016) Structural determinants of Constitutive Activation of Gα proteins: Transducin as a Paradigm. J J Chem Theory Comput 13: 886-899.
- Behnen P, Felline A, Comitato A, Di Salvo MT, Raimondi F, Gulati S, Kahremany S, Palczewski K, Marigo V, Fanelli F. (2018). A small chaperone improves folding and routing of rhodopsin mutants linked to inherited blindness. IScience 4: 1-19.
- Felline A, Belmonte L, Raimondi F, Bellucci L, Fanelli F (2019) Interconnecting Flexibility, Structural Communication, and Function in RhoGEF Oncoproteins. J. Chem. Inf. Model. 59: 4300-4313.
- Konagurthu AS, Whisstock JC, Stuckey PJ, Lesk AM (2006) MUSTANG: a multiple structural alignment algorithm. Proteins 64: 559-574.
- Wang S, Peng J, Xu J (2011) Alignment of distantly related protein structures: algorithm, bound and implications to homology modeling. Bioinformatics 27: 2537-2545.
- Sievers F, Higgins DG (2014) Clustal Omega, accurate alignment of very large numbers of sequences. Methods Mol Biol. 1079: 105-116.
- Ge P, Zhang S (2015) STAR3D: a stack-based RNA 3D structural alignment tool. Nucleic Acids Res. 43: e137.
- Ritchie DW (2016) Calculating and scoring high quality multiple flexible protein structure alignments. Bioinformatics 32: 2650-2658.
- Brinda KV, Vishveshwara S (2005) A network representation of protein structures: implications for protein stability. Biophys J 89: 4159-4170.
- Van Wynsberghe A.W., Cui Q. (2006) Interpreting correlated motions using normal mode analysis. Structure 14: 1647-1653.
- Seeber M, Felline A, Raimondi F, Muff S, Friedman R, Rao F, Caflisch A, Fanelli F (2011) Wordom: A user-friendly program for the analysis of molecular structures, trajectories, and free energy surfaces. J Comput Chem 32: 1183-1194.
- Dijkstra E.W. (1959) A Note on Two Problems in Connexion with Graphs. Numer. Math. 1: 269-271.
- Jaccard, P. (1912) The distribution of the flora in the alpine zone. New Phytologist, 11: 37-50.
- Cluster Analysis for Researchers. By H. Charles Romesburg. (Belmont, Calif.: Lifetime Learning Publications, 1984. Pp. xiii 334). (1984). American Political Science Review, 78(4), 1211-1211.
- Vijaymeena, M. K.; Kavitha, K. (2016) A Survey on Similarity Measures in Text Mining. Machine Learning and Applications. 3 (1): 19–28.
- Przulj, N. Biological network comparison using graphlet degree distribution. Bioinformatics 23, 177–183 (2007).